. 2013 Sep 30;202(7):1013-22.
doi: 10.1083/jcb.201303141.

PLP inhibits the activity of interphase centrosomes to ensure their proper segregation in stem cells

Affiliations

PLP inhibits the activity of interphase centrosomes to ensure their proper segregation in stem cells

Dorothy A Lerit et al. J Cell Biol. .

Abstract

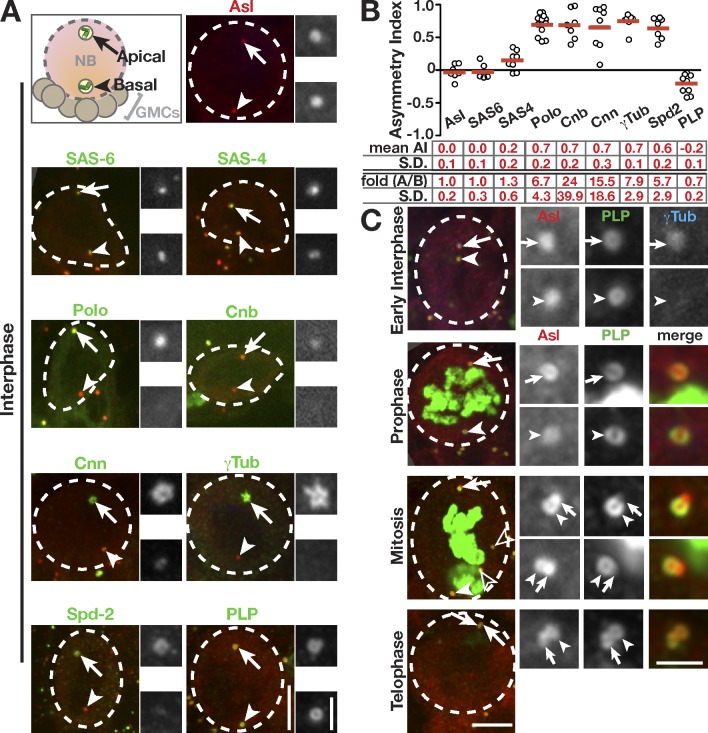
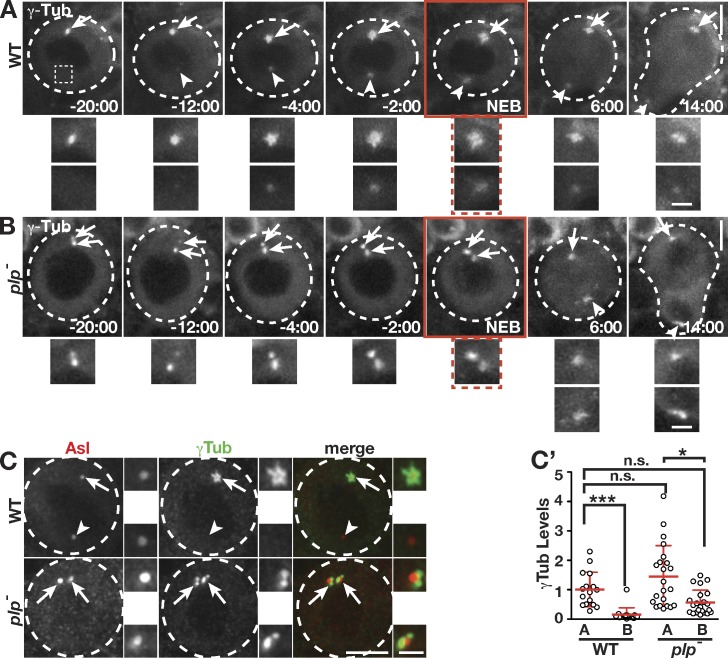
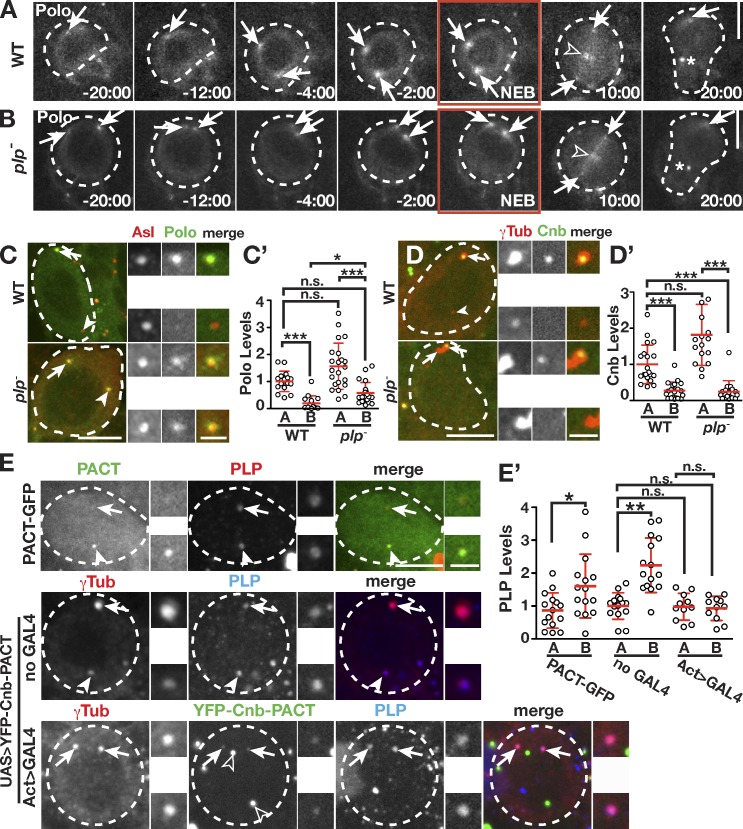
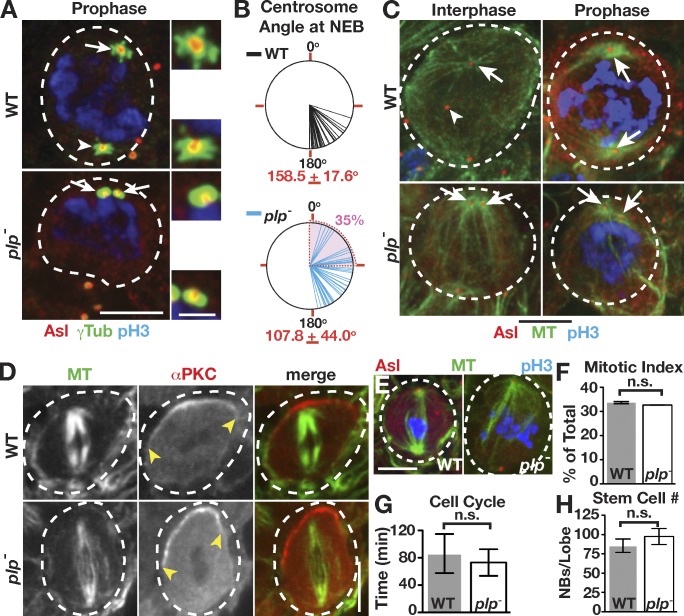
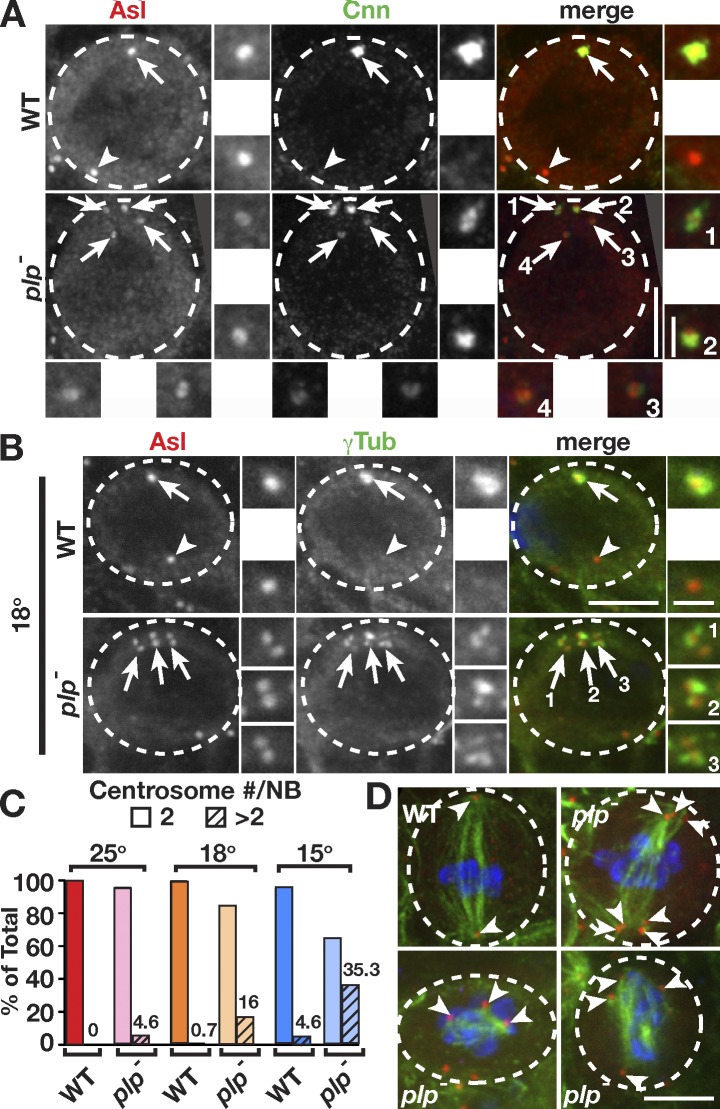
Centrosomes determine the mitotic axis of asymmetrically dividing stem cells. Several studies have shown that the centrosomes of the Drosophila melanogaster central brain neural stem cells are themselves asymmetric, organizing varying levels of pericentriolar material and microtubules. This asymmetry produces one active and one inactive centrosome during interphase. We identify pericentrin-like protein (PLP) as a negative regulator of centrosome maturation and activity. We show that PLP is enriched on the inactive interphase centrosome, where it blocks recruitment of the master regulator of centrosome maturation, Polo kinase. Furthermore, we find that ectopic Centrobin expression influenced PLP levels on the basal centrosome, suggesting it may normally function to regulate PLP. Finally, we conclude that, although asymmetric centrosome maturation is not required for asymmetric cell division, it is required for proper centrosome segregation to the two daughter cells.


Figures

Figure 1.
Figure 1.
PLP is enriched on the mother centrosome in interphase. The indicated proteins (green) were detected by immunofluorescence or direct fluorescence in interphase NBs (dashed circles) counterstained for Asl to localize apical/daughter (arrows) and basal/mother (arrowheads) centrosomes. The adjacent boxes (grayscale) are magnifications of the indicated proteins showing the apical (top) and basal (bottom) centrioles. (A) Projections of NBs. Cnn, Centrosomin. (B) Quantification of AI. Each data point from the graph represents one measurement from a single cell; data were collected from five to nine NBs from three to six brains. The means ± SD are shown by the red bars and numbers below the graph. Absolute fold enrichment (A/B) is also indicated. See Materials and methods for details. (C) Projections of WT NBs showing PLP distribution on centrioles. Mitotic cells are marked by pH3 (green), and open arrowheads indicate centrosomes from other cells. GMCs, ganglion mother cells. Bars: (main images) 5 µm; (insets) 1.5 µm.
Figure 2.
Figure 2.
PLP prevents the maturation of the mother centrosome. (A and B) Live GFP–γ-Tub in WT (A) and plp (B) NBs. Apical (arrows) and basal (arrowheads) centrosomes are enlarged and shown below. A basal location from −20 min WT is enlarged to indicate no detectable γ-Tub (dotted box). Times are minutes and seconds relative to NEB (red boxes). (C) Projections of interphase NBs showing anti–γ-Tub. (C′) Quantification is of γ-Tub levels at interphase apical (A) and basal (B) centrosomes from single NBs (WT: n = 16, 5 brains; plp: n = 22, 6 brains). Data shown are from a single representative experiment from four repeats. See Materials and methods for statistical analysis. Data are means ± SD. *, P < 0.01. The adjacent boxes (grayscale) are magnifications of the indicated proteins showing the apical (top) and basal (bottom) centrioles. Dashed circles, NBs. Bars: (main images) 5 µm; (insets) 1.5 µm.
Figure 3.
Figure 3.
PLP prevents the localization of Polo to the mother centrosome. (A and B) Live Polo-GFP in WT (A) and plp (B) NBs. Polo also localizes to kinetochores (open arrowheads) and the midbody ring (asterisks). Times are minutes and seconds relative to NEB (red boxes). (C–E) Projections of NBs showing Polo-GFP (C), Cnb-GFP (D), and PLP (E). Open arrowheads in E show nonspecific YFP signals. Quantification in NBs of Polo (C′) from WT (n = 16, 5 brains) and plp (n = 22, 5 brains), Cnb (D′) from WT (n = 20, 6 brains) and plp (n = 17, 7 brains), and PLP (E′) levels from PACT-GFP (n = 16, 7 brains), UAS>YFP-Cnb-PACT/+ (no GAL4; noninduced; n = 15, 6 brains), and UAS>YFP-Cnb-PACT/Act>GAL4 (induced; n = 11, 4 brains). Data shown are from a single representative experiment from two repeats. See Materials and methods for statistical analysis. Only plp cells containing two γ-Tub–positive centrosomes were selected for quantification of Cnb in D′. The α-PLP antibody is against the N terminus and does not detect the PACT constructs. In all panels, apical (arrows) and basal (arrowheads) centrosomes are indicated. Data are means ± SD. *, P < 0.01; **, P < 0.001; ***, P < 0.0001. The adjacent boxes (grayscale) are magnifications of the indicated proteins showing the apical (top) and basal (bottom) centrioles. Dashed circles, NBs. A, apical; B, basal. Bars: (main images) 5 µm; (insets) 1.5 µm.
Figure 4.
Figure 4.
PLP is required for centrosome inheritance but not ACD. (A) Projections of prophase WT and plp NBs. Active (arrows) and inactive (arrowheads) centrosomes are indicated. The adjacent boxes are magnifications of the indicated proteins showing the apical (top) and basal (bottom) centrioles. (B) Angle of centrosome separation at NEB from live γ-Tub analysis of WT and plp NBs: WT (n = 42) and plp (n = 46). The mean angle of centrosome separation is significantly different: P < 0.0001, two-tailed Student’s t test. The means ± SD are indicated in red, and the shaded area corresponds to <90°. (C) Interphase and mitotic MTOCs from WT and plp NBs. (D) WT and plp NBs showed no difference in proper spindle alignment along the apical (α-PKC, yellow arrowheads) and basal axis. (E) Some plp mitotic spindles are abnormal compared with WT. (F–H) Mitotic index (WT: n = 38/169; plp: n = 32/150; F), cell cycle length (WT: n = 26; plp: n = 39; G), and NB number from anterior and posterior optic lobe (stained for Mira; H) are all unaffected and displayed as means ± SD. Dashed circles, NBs. Bars: (main images) 5 µm; (insets) 1.5 µm.
Figure 5.
Figure 5.
plp mutant cells contain supernumerary centrosomes. (A and B) WT and plp larvae were grown from first to third instar at 25°C (A) or 18°C (B). plp NBs contain supernumerary centrosomes (arrows). The adjacent boxes (grayscale) are magnifications of the indicated proteins showing the apical (top) and basal (bottom) centrioles. Cnn, Centrosomin. (C) Quantification of supernumerary centrosomes was determined by counting the number of NBs containing more than two Asl-positive centrosomes divided by the total number of NBs. Frequency is indicated on each column, and means ± SD percentages were as follows: 25°C (WT: n = 0/57, 7 brains, 0%; plp: n = 15/323, 24 brains, 4.6 ± 0.9%), 18°C (WT: n = 1/148, 9 brains, 0.7 ± 0.2%; plp: n = 30/187, 9 brains, 16 ± 1.3%), and 15°C (WT: n = 6/109, 8 brains, 4.6 ± 0.6%; plp: n = 36/102, 5 brains, 35 ± 1.4%). (D) Mitotic spindles from one WT and three plp cold-treated NBs; green (MTs), red (Asl), and blue (pH3). Arrowheads label spindle poles. Dashed circles, NBs. Bars: (main images) 5 µm; (insets) 1.5 µm.

Similar articles

Cited by

References

    1. Basto R., Brunk K., Vinadogrova T., Peel N., Franz A., Khodjakov A., Raff J.W. 2008. Centrosome amplification can initiate tumorigenesis in flies. Cell. 133:1032–1042 10.1016/j.cell.2008.05.039 - DOI - PMC - PubMed
    1. Cabernard C., Doe C.Q. 2009. Apical/basal spindle orientation is required for neuroblast homeostasis and neuronal differentiation in Drosophila. Dev. Cell. 17:134–141 10.1016/j.devcel.2009.06.009 - DOI - PubMed
    1. Castellanos E., Dominguez P., Gonzalez C. 2008. Centrosome dysfunction in Drosophila neural stem cells causes tumors that are not due to genome instability. Curr. Biol. 18:1209–1214 10.1016/j.cub.2008.07.029 - DOI - PubMed
    1. Conduit P.T., Raff J.W. 2010. Cnn dynamics drive centrosome size asymmetry to ensure daughter centriole retention in Drosophila neuroblasts. Curr. Biol. 20:2187–2192 10.1016/j.cub.2010.11.055 - DOI - PubMed
    1. Dix C.I., Raff J.W. 2007. Drosophila Spd-2 recruits PCM to the sperm centriole, but is dispensable for centriole duplication. Curr. Biol. 17:1759–1764 10.1016/j.cub.2007.08.065 - DOI - PMC - PubMed

Publication types

MeSH terms

Substances