. 2013 Oct 21;210(11):2223-37.
doi: 10.1084/jem.20131219. Epub 2013 Sep 30.

Aging predisposes to acute inflammatory induced pathology after tumor immunotherapy

Affiliations

Aging predisposes to acute inflammatory induced pathology after tumor immunotherapy

Myriam N Bouchlaka et al. J Exp Med. .

Abstract

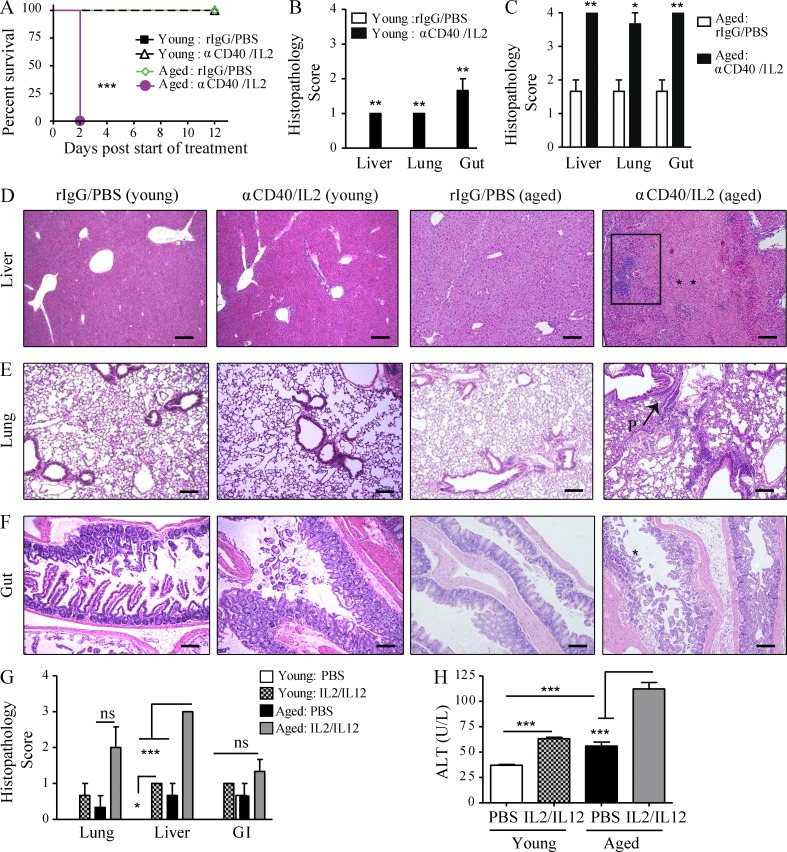
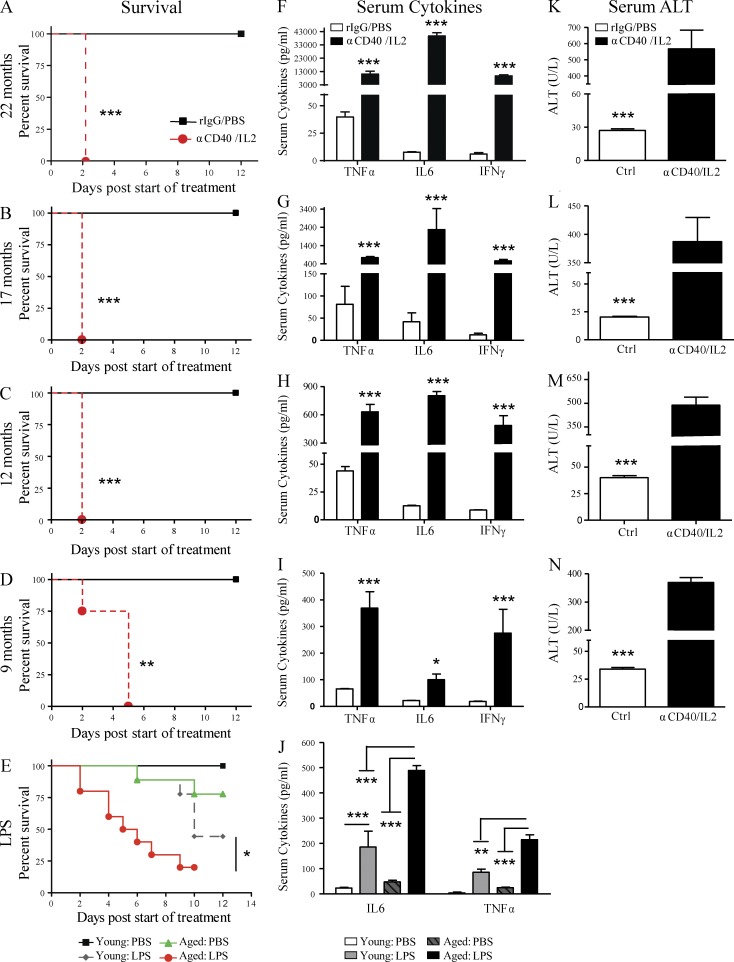
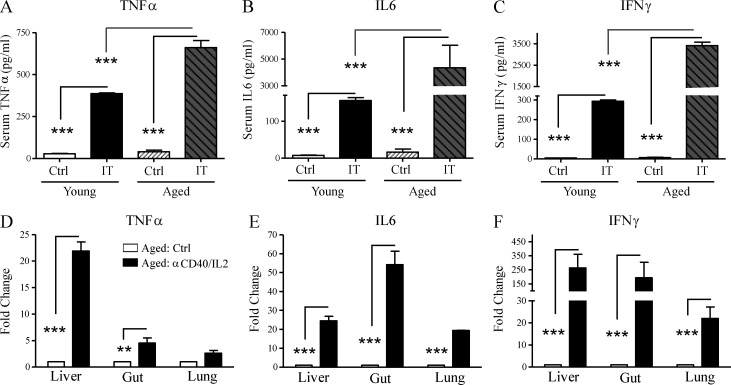
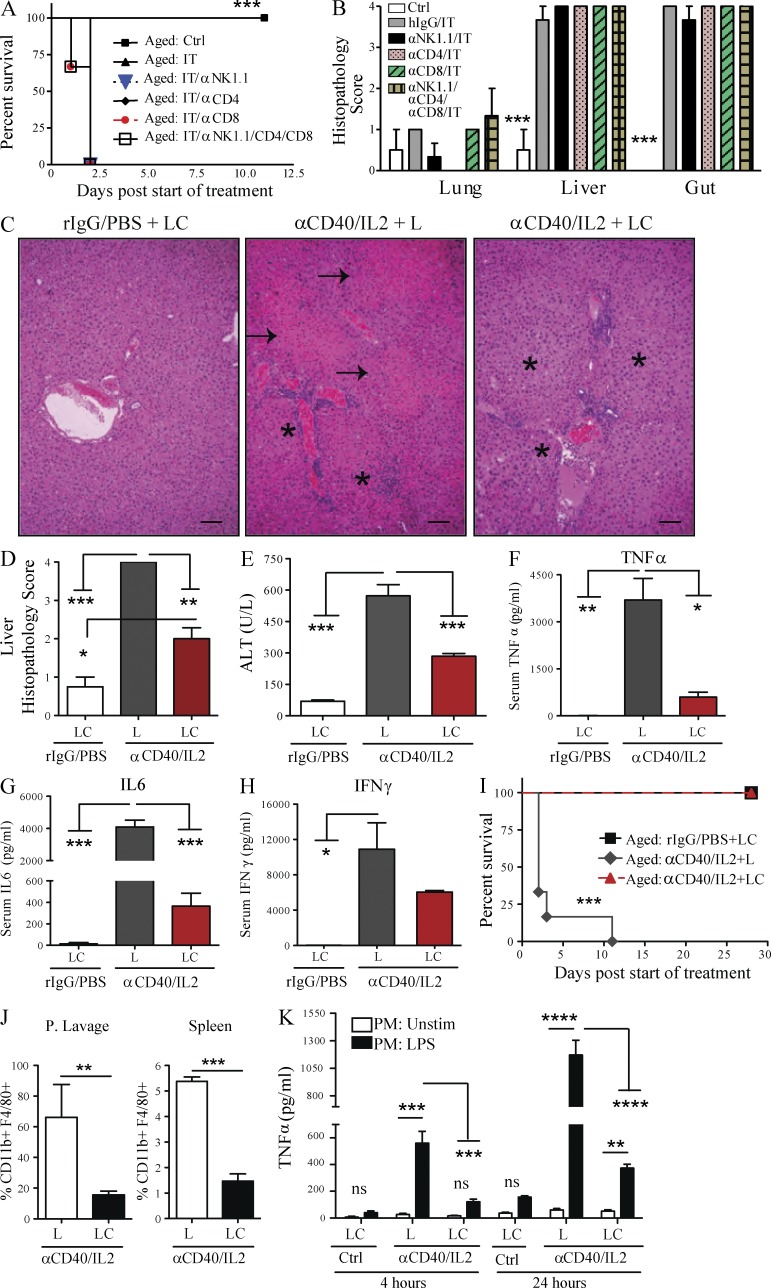
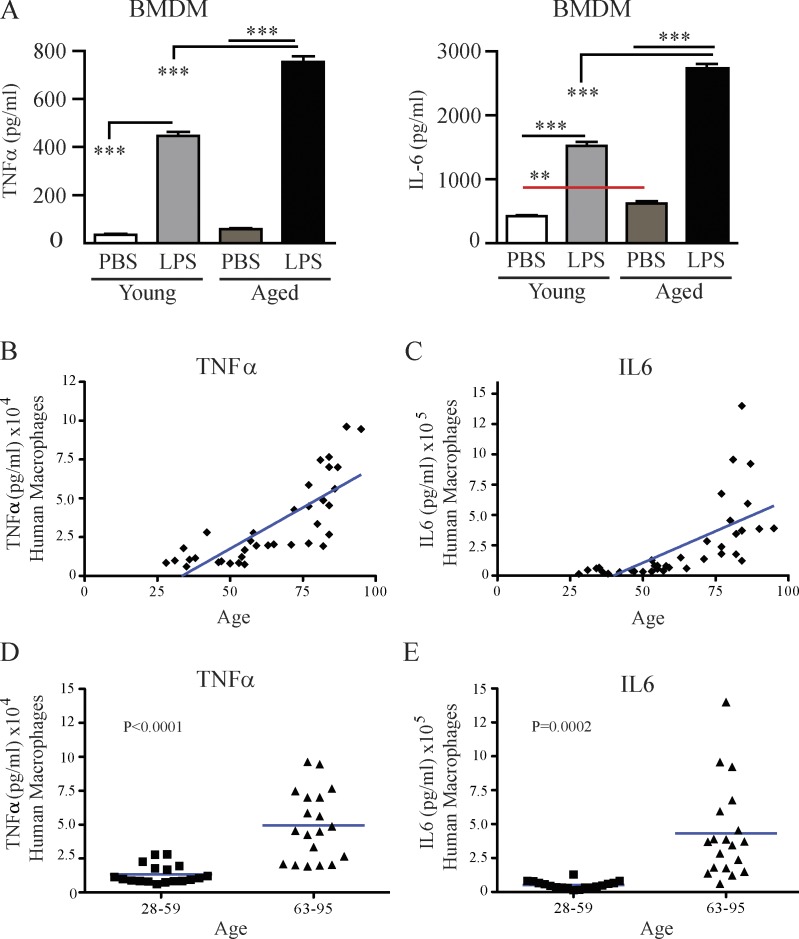
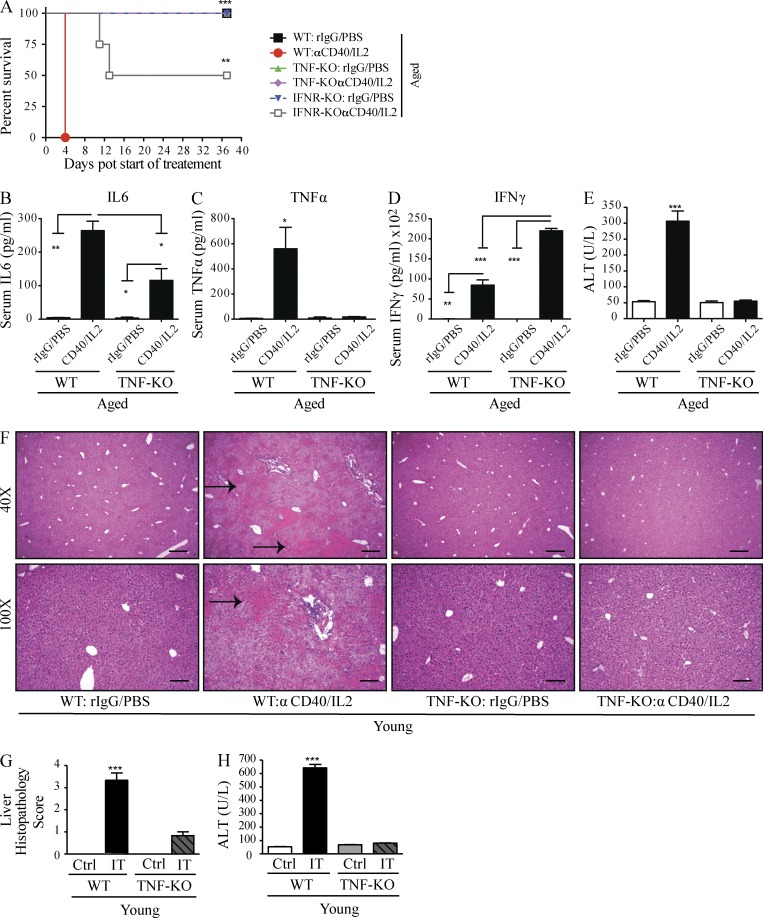
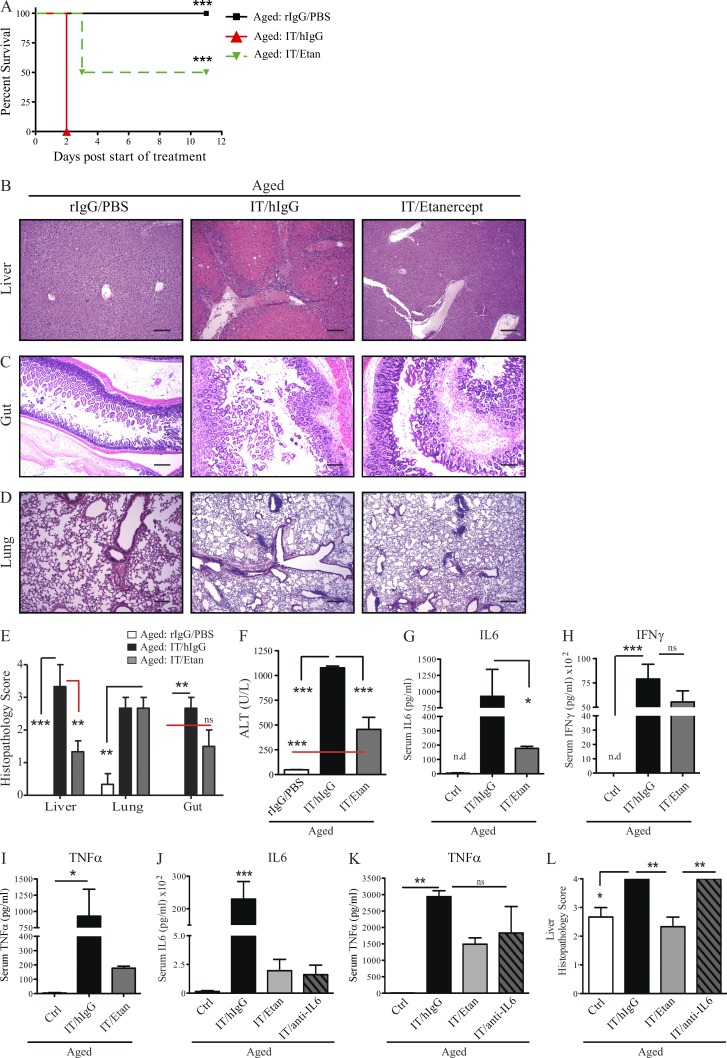
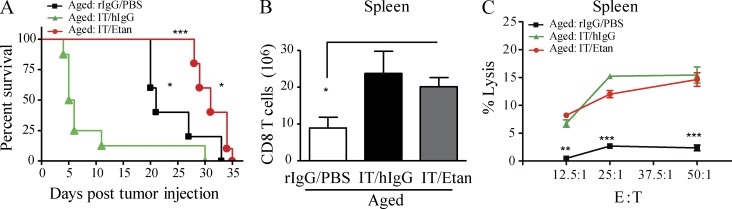
Cancer commonly occurs in the elderly and immunotherapy (IT) is being increasingly applied to this population. However, the majority of preclinical mouse tumor models assessing potential efficacy and toxicities of therapeutics use young mice. We assessed the impact of age on responses to systemic immune stimulation. In contrast to young mice, systemic cancer IT regimens or LPS given to aged mice resulted in rapid and lethal toxicities affecting multiple organs correlating with heightened proinflammatory cytokines systemically and within the parenchymal tissues. This inflammatory response and increased morbidity with age was independent of T cells or NK cells. However, prior in vivo depletion of macrophages in aged mice resulted in lesser cytokine levels, increased survival, and decreased liver histopathology. Furthermore, macrophages from aged mice and normal human elderly volunteers displayed heightened TNF and IL-6 production upon in vitro stimulation. Treatment of both TNF knockout mice and in vivo TNF blockade in aged mice resulted in significant increases in survival and lessened pathology. Importantly, TNF blockade in tumor-bearing, aged mice receiving IT displayed significant anti-tumor effects. These data demonstrate the critical role of macrophages in the age-associated hyper-inflammatory cytokine responses to systemic immunostimulation and underscore the importance of performing preclinical assessments in aged mice.


Figures

Figure 1.
Figure 1.
Increased mortality and multiorgan pathology in aged mice after high-dose anti-CD40/IL-2 treatment or after IL-2/IL-12. (A) Survival of young (4 mo) and aged (22 mo) naive C57BL/6 mice that received high-dose anti-CD40/IL-2 or rIgG/PBS, n = 5–8. (B–F) Three mice from each treated group in A were evaluated for histopathological differences in the liver at day 2. (B and C) Liver histopathology scoring (see Materials and methods) of young (B) and aged (C) mice. (D–F) Representative images of liver, lung, or gut H&E staining for young or aged mice. Bars, 500 µm. Liver necrosis (D) is indicated by ** and the rectangular area illustrating periportal lymphocytic aggregates. P: peribronchitis (E) in the lungs of aged mice. Gut mucosal erosion and damage (D) in aged mice is indicated by *. Data are representative of one of three independent experiments with similar results. Survival analysis was plotted according to the Kaplan-Meier method, and statistical differences were determined with the log-rank test. ***, P < 0.001; **, P < 0.01; *, P < 0.05. Ctrl: control. (G and H) Young (4 mo) and aged (17 mo) BALB/c mice received either PBS in the control group or 3 × 10⁵ IU IL-2 and 0.5 µg IL-12. (G) Histopathology of the lungs, livers, and gastrointestinal tracts collected at day 11 of treatment were scored and (H) serum ALT was quantified, n = 3. Values represent the mean ± SEM of one experiment. Bar graph (mean ± SEM) statistics were determined using two-way ANOVA with Bonferroni’s post-test, ***, P < 0.001; **, P < 0.01; *, P < 0.05. n.s.: not significant. &: P < 0.001 against all groups. A–F are representative of four and G and H of two independent experiments.
Figure 2.
Figure 2.
Anti-CD40/IL-2 and LPS-mediated mortality and associated toxicities worsen with age. Survival of aged (A and B; 22 and 17 mo) and middle-aged (C and D; 9 and 12 mo) C57BL/6 mice after high-dose anti-CD40/IL-2 treatment or rIgG/PBS treatment (control). n = 5 in controls and n = 6–8 in anti-CD40/IL-2. (E) Survival of young (2–4 mo) or aged (17–18 mo) BALB/c mice that received 1.5 mg/kg LPS or PBS on day 0, n = 9–10. (F–I) Serum collected from mice of the same age and treatment regimen as in A–D was quantified for TNF, IL-6, and IFN-γ levels. (J) Serum IL-6 and TNF was assessed in young (4 mo) or aged (17–18 mo) mice from 48 h (E) after in vivo PBS or LPS treatment. (K–N) Serum ALT levels (measure of liver necrosis) from mice of F–I. A–D, F–I, and K–N are representative of four independent experiments, and E and J are representative of three independent experiments. Survival analysis was plotted according to the Kaplan-Meier method, and statistical differences were determined with the log-rank test. Bar graph (mean ± SEM) statistics were determined by two-way ANOVA with Bonferroni’s post-tests. ***, P < 0.001; **, P < 0.01; *, P < 0.05. Ctrl: control.
Figure 3.
Figure 3.
Exacerbated systemic and in situ proinflammatory cytokine production after anti-CD40/IL-2 in aged mice. (A–C) Serum cytokines from young (2 mo) and aged (9 mo) C57BL/6 mice (n = 3) that received high-dose anti-CD40/IL-2 (IT) or rIgG/PBS (Ctrl) were measured for TNF, IL-6, and IFN-γ production 48 h after treatment. (D–F) TNF (D), IL-6 (E), and IFN-γ (F) mRNA expression in livers, gut, and lungs of middle-aged (9 mo) treated C57BL/6 mice (day 2), n = 3. Data are representative of three independent experiments. Values represent the mean ± SEM of one experiment. Bar graph (mean ± SEM) statistics were determined using two-way ANOVA with Bonferroni’s post-test. ***, P < 0.001; **, P < 0.01 against all groups. Ctrl: control. IT: anti-CD40/IL-2.
Figure 4.
Figure 4.
Liver pathology, systemic toxicities, and mortality from anti-CD40/IL-2 in aged mice are macrophage dependent. (A) Survival of aged (9 mo) C57BL/6 after low-dose anti-CD40/IL-2 (IT). At day −3, certain groups were NK depleted (300 µg), CD4 T cell depleted (500 µg), CD8 T cell depleted (500 µg), or received all three depletions before the start (day −3) of anti-CD40/IL-2 (n = 3–4). The control (Ctrl) group received rIgG/PBS. Survival analysis was plotted according to the Kaplan-Meier method, and statistical differences were determined with the log-rank test. (B) Similar treatments as in A were established, and 2 d after the start of IT, mice were euthanized, liver, lung, and intestines were H&E stained, and the histopathology in each organ and group was scored, n = 3. (C–H) Aged (13 mo) C57BL/6 mice received rIgG/PBS or low-dose anti-CD40/IL-2 in combination with liposome clodronate or anti-CD40/IL-2 with liposomes (L) only and euthanized at day 2. (C) Representative images of liver H&E sections. Bars, 500 µm. Asterisks point at lymphocytic infiltrates and arrows represent necrosis. (D and E) Liver histopathology score (D) and serum ALT (E) in all three groups. (F–H) Serum level of TNF (F), IL-6 (G), and IFN-γ (H). (I) Percent survival in aged (13 mo) mice treated with rIgG/PBS + LC, or anti-CD40/IL-2 + L or anti-CD40/IL-2 + LC, n = 6. (J) Percentage of CD11b+ F4/80+ macrophages gated on CD45+ CD19 in peritoneal lavage or spleen cells from C–H to check for macrophage depletion in anti-CD40/IL-2 + L or anti-CD40/IL-2 + LC groups at day 2, n = 3. (K) Peritoneal lavage cells from mice in C–H were cultured and stimulated with PBS or LPS (50 ng/ml) and TNF levels were measured at 4 and 24 h after treatment. One-way or two-way ANOVA of analysis with Bonferroni’s post-tests was performed. Survival analysis was plotted according to the Kaplan-Meier method, and statistical differences were determined with the log-rank test. Values represent the mean ± SEM with Bonferroni’s post-test. ***, P < 0.001; **, P < 0.01; *, P < 0.05. n.s: not significant. A–K are representative of three independent experiments.
Figure 5.
Figure 5.
Ex vivo LPS-stimulated mouse and human macrophages have increased TNF and IL-6 production in an age-dependent manner. (A) Young (4 mo) or aged (17–18 mo) C57BL/6 mice received PBS or LPS and on day 3, monocytes from the BM were isolated, differentiated into macrophages (BMDM), and ex vivo restimulated with either PBS or LPS for 24 h to assess TNF and IL-6 levels. (B–E) Monocytes derived from the PBMCs of 37 donors aging from 28 to 95 yr old were isolated and differentiated into macrophages over 10 d and were then stimulated for 48 h with 50 ng/ml LPS or PBS, and TNF and IL-6 production was assessed. Data are illustrated in two different manners: (B and C) data for TNF and IL-6 production by macrophages in donor cohorts ranging from 28 to 59 yr old as a scatter plot; (D and E) data analyzed by grouping the 28–59 and the 63–95 yr olds. Mouse data were analyzed by one-way analysis with Bonferroni’s post-tests, n = 3. A is representative three independent experiments and B–E are representative of one experiment. Human data in D and E were analyzed by a Student’s t test (horizontal bars represent means), and p-values are indicated on graphs in C and D.
Figure 6.
Figure 6.
TNF-dependent systemic toxicity after low-dose anti-CD40/IL-2 treatment. (A) Survival of aged (16 mo) C57BL/6 (WT), IFNR-KO, and TNF-KO mice that received low-dose anti-CD40/IL-2 or aged matched controls, n = 3–5. Survival analysis was plotted according to the Kaplan-Meier method, and statistical differences were determined with the log-rank test. (B–E) Serum cytokines and ALT levels from the aged WT and age-matched TNF-KO (12 mo) including TNF, IL-6, and IFN-γ and ALT after 2 d of treatment, n = 3. (F–H) Young C57BL/6 WT and TNF-KO (2 mo) mice (n = 3) were treated for 2 d with high-dose anti-CD40/IL-2 or control treatment, and liver histopathology (F and G) and serum ALT (H) levels were assessed for each group. (F) Representative H&E liver images with black arrows pointing to areas of necrosis. Bars: (top) 500 µm; (bottom) 200 µm. Statistical analysis was by one-way ANOVA. ***, P < 0.001; **, P < 0.01; *, P < 0.05. Bar graphs represent the mean ± SEM. (A–H) are representative of two independent experiments.
Figure 7.
Figure 7.
Combination of TNF blockade and anti-CD40/IL-2 increases survival, decreases systemic cytokine storm, and protects from liver pathology in aged mice. (A) Percent survival of aged (12 mo) C57BL/6 mice receiving low-dose anti-CD40/IL-2 with etanercept (Etan; 1.5 mg/0.2 ml s.c.), or hIgG (1.5 mg/0.2 ml s.c.) or rIgG/PBS, n = 6–8. Survival analysis was plotted according to the Kaplan-Meier method, and statistical differences were determined with the log-rank test. (B–F) Liver (B), gut (C), and lung (D) pathology and serum ALT (F) in aged mice (12 mo), n = 3. (B–D) One representative image from each group and each organ was captured. Bars, 50 µm. (E) Multiorgan histopathology score from B–D. (G–I) Serum cytokines from groups in B–F were examined for IL-6(G), IFN-γ (H), and TNF (I; day 2) in young (2 mo) and aged (12 mo) mice. Etanercept was administered on days −1 and 1. (J–L) Aged C57BL/6 mice (12 mo old) received on day −1 either hIgG (1.5 mg/0.2 ml s.c.), or etanercept (Etan; 1.5 mg/0.2 ml s.c.), or anti–IL-6 antibody (1.0 mg/0.2ml i.p) with combination of low-dose anti-CD40/IL-2 (IT) on day 0. Control (Ctrl) group received rIgG/PBS, n = 3. (J and K) Serum cytokine levels for IL-6 (J) and TNF (K) were assessed after 2 d of treatment. (L) Liver histopathology from mice in J and K was assessed for each group. Values represent the mean ± SEM tested by one-way ANOVA with Bonferroni’s post-tests. ***, P < 0.001; **, P < 0.01; *, P < 0.05 compared with control group. n.s: not significant. Data from A–I are representative of three independent experiments and data from J–L are representative of two independent experiments.
Figure 8.
Figure 8.
TNF blockade results in anti-tumor effects after anti-CD40/IL-2 therapy in aged mice. (A) Tumor survival in aged (12–15 mo) mice that received 3LL i.v. (day −3), followed by low-dose anti-CD40/IL-2 with etanercept (n = 8–10) or hIgG (n = 6) or PBS/rIgG (n = 6). (B and C) Number of CD3+ CD8+ T cells in the spleen after 9 d of treatment in aged (12 mo) C57BL/6 mice (B) and their percent lysis of total spleen cells against P815 tumors at different effector to target ratio (C), n = 3. Survival analysis was plotted according to the Kaplan-Meier method, and statistical differences were determined with the log-rank test. ***, P < 0.001, IT/hIgG versus IT/etanercept; *, P < 0.05, IT/Etanercept versus rIgG/PBS; *, P < 0.01, rIgG/PBS versus Low IT/hIgG. Survival curve of one of two independent experiments is represented. For B and C, values represent the mean ± SEM of one of two independent experiments tested by one-way or two-way ANOVA, respectively. ***, P < 0.001; **, P < 0.01; *, P < 0.05 compared with control group. A–C are representative of three independent experiments.

Comment in

References

    1. Aggarwal B.B. 2003. Signalling pathways of the TNF superfamily: a double-edged sword. Nat. Rev. Immunol. 3:745–756 10.1038/nri1184 - DOI - PubMed
    1. Anonymous 1997. Banff schema for grading liver allograft rejection: an international consensus document. Hepatology. 25:658–663 10.1002/hep.510250328 - DOI - PubMed
    1. Arthur J.C., Perez-Chanona E., Mühlbauer M., Tomkovich S., Uronis J.M., Fan T.J., Campbell B.J., Abujamel T., Dogan B., Rogers A.B., et al. 2012. Intestinal inflammation targets cancer-inducing activity of the microbiota. Science. 338:120–123 10.1126/science.1224820 - DOI - PMC - PubMed
    1. Attarwala H. 2010. TGN1412: From Discovery to Disaster. J Young Pharm. 2:332–336 10.4103/0975-1483.66810 - DOI - PMC - PubMed
    1. Balkwill F. 2009. Tumour necrosis factor and cancer. Nat. Rev. Cancer. 9:361–371 10.1038/nrc2628 - DOI - PubMed

Publication types

MeSH terms