. 2013 Oct;142(4):425-36.
doi: 10.1085/jgp.201310968.

Hexokinase-mitochondrial interactions regulate glucose metabolism differentially in adult and neonatal cardiac myocytes

Affiliations

Hexokinase-mitochondrial interactions regulate glucose metabolism differentially in adult and neonatal cardiac myocytes

Guillaume Calmettes et al. J Gen Physiol. 2013 Oct.

Abstract

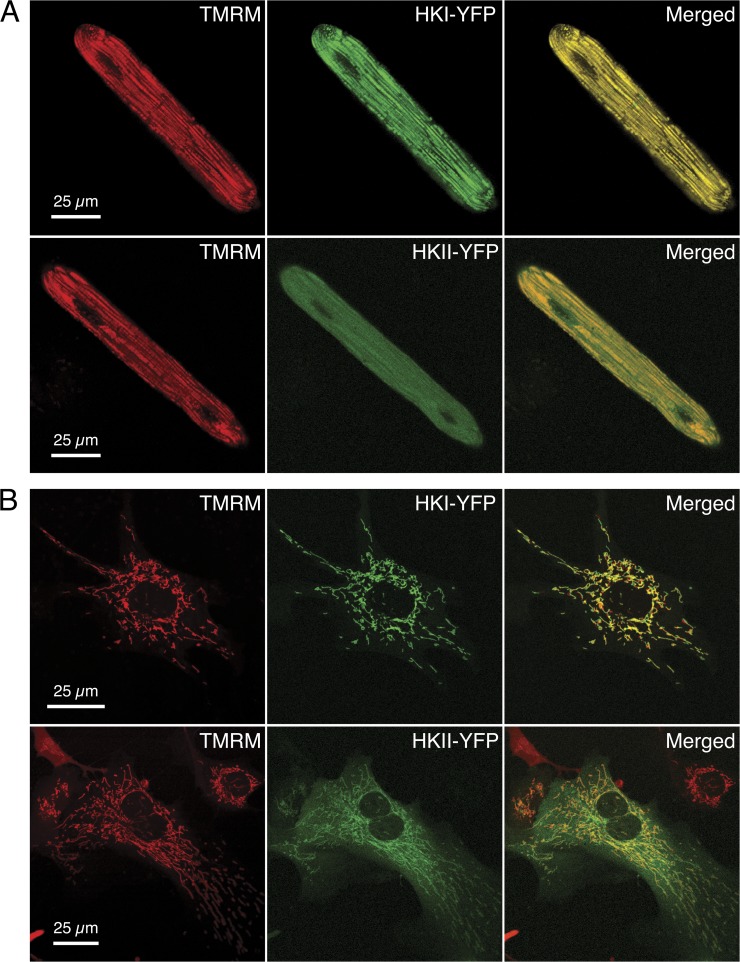
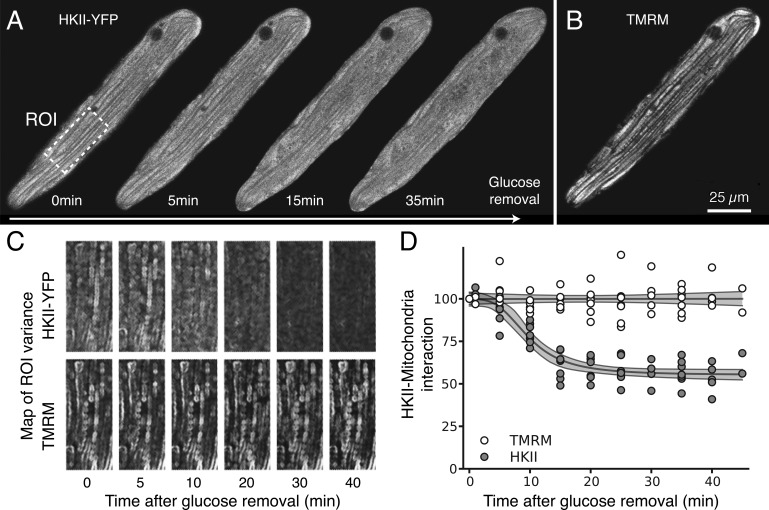
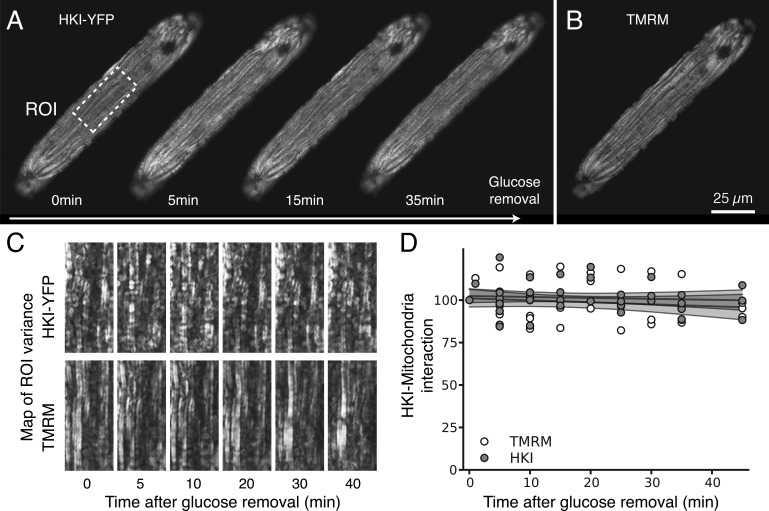
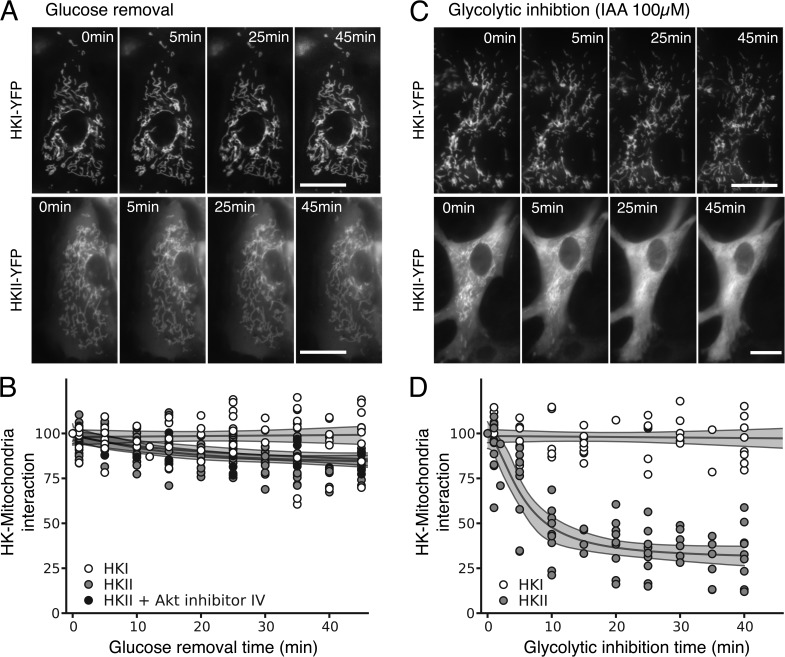
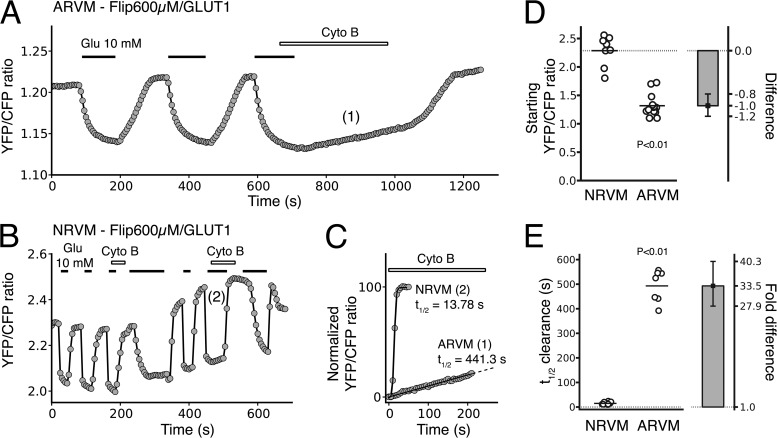
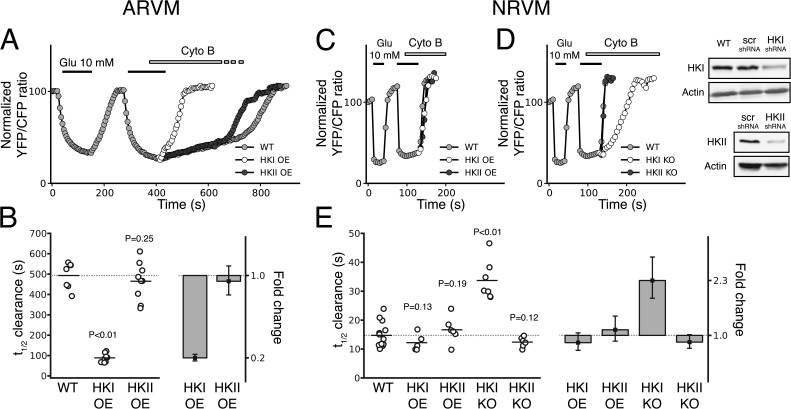
In mammalian tumor cell lines, localization of hexokinase (HK) isoforms to the cytoplasm or mitochondria has been shown to control their anabolic (glycogen synthesis) and catabolic (glycolysis) activities. In this study, we examined whether HK isoform differences could explain the markedly different metabolic profiles between normal adult and neonatal cardiac tissue. We used a set of novel genetically encoded optical imaging tools to track, in real-time in isolated adult (ARVM) and neonatal (NRVM) rat ventricular myocytes, the subcellular distributions of HKI and HKII, and the functional consequences on glucose utilization. We show that HKII, the predominant isoform in ARVM, dynamically translocates from mitochondria and cytoplasm in response to removal of extracellular glucose or addition of iodoacetate (IAA). In contrast, HKI, the predominant isoform in NRVM, is only bound to mitochondria and is not displaced by the above interventions. In ARVM, overexpression of HKI, but not HKII, increased glycolytic activity. In neonatal rat ventricular myocytes (NVRM), knockdown of HKI, but not HKII, decreased glycolytic activity. In conclusion, differential interactions of HKI and HKII with mitochondria underlie the different metabolic profiles of ARVM and NRVM, accounting for the markedly increased glycolytic activity of NRVM.


Figures

Figure 1.
Figure 1.
Subcellular distribution of HKI and HKII linked to YFP in ARVM and NRVM. Confocal images of an ARVM (A) and a NRVM (B) overexpressing HKI and HKII tagged with YFP (green) and loaded with TMRM (red). Merged YFP and TMRM images show complete colocalization of HKI with mitochondria (yellow color), but only partial colocalization of HKII, with the remainder diffusely present through the cytoplasm. Confocal images were acquired half-way through the height of the myocyte in the z direction.
Figure 2.
Figure 2.
Glucose removal induces dissociation of HKII from mitochondria in ARVM. (A) The images obtained with adenoviral HKII-YFP construct expressed in ARVM show that 5–10 min after glucose removal, HKII progressively dissociated from mitochondria. (B) By comparison, the TMRM signal labeling the mitochondrial network was not affected by removal of glucose, even after 30 min. (C) Translocation of HKII from mitochondria to cytoplasm was quantified by computing the spatial variance of the fluorescence over time (see Materials and methods for details and Fig. S1). After glucose removal, the spatial variance of the HKII-YFP image decreased over time, showing that HKII is released and diffuses evenly through the cytoplasm. In contrast, no change in variance is observed in TMRM fluorescence (internal control). (D) Changes (percentage of control) in spatial variance of HKII-YFP (gray dots) and TMRM (white dots) during glucose removal, which indicates HKII dissociation from mitochondria. Fit of the data (gray lines), from which the time constant of dissociation can be calculated (see Results). The corresponding shaded gray areas represent 95% CIs of the fit model.
Figure 3.
Figure 3.
Glucose removal does not affect HKI interaction with mitochondria in ARVM. (A) In contrast to Fig. 2, images obtained with ARVM expressing an adenoviral HKI-YFP construct show that removal of glucose had no effect on HKI binding to mitochondria, which suggests that HKI has a much stronger binding affinity for mitochondria compared with HKII in ARVM. (B) TMRM image of the corresponding mitochondrial network after 30 min of glucose removal. (C and D) Spatial variance (see Materials and methods for details and Fig. S1) of HKI-YFP and TMRM at various time points after glucose removal, revealing the lack of effect of glucose removal on HKI’s interaction with mitochondria. Gray lines in D show the fit of the data, with surrounding shaded gray areas representing 95% CIs of the fit model.
Figure 4.
Figure 4.
Effects of glucose removal, IAA and Akt inhibition on HKI, and HKII binding to mitochondria in NRVM. (A) Images of NRVM expressing the adenoviral HKI-YFP (top) and HKII-YFP (bottom) construct during glucose removal. (B) Quantitative spatial variance of HKI-YFP and HKII-YFP images reveals that HKI binding to mitochondria is insensitive to glucose removal in NRVM, whereas in contrast to ARVM, HKII hardly dissociates in NRVM. Inhibition of Akt did not make HKII more dissociable during glucose removal. (C) Images of NRVM expressing the adenoviral HKI-YFP (top) and HKII-YFP (bottom) construct during glycolytic inhibition with IAA. Bars, 25 µm. (D) Quantitative spatial variance of HKI-YFP and HKII-YFP images shows that IAA caused the dissociation of HKII from mitochondria to cytoplasm, but doesn’t have any effect on HKI.
Figure 5.
Figure 5.
Glucose utilization in ARVM and NRVM. (A and B) The FRET-based glucose nanosensor Flipglu-600 µM was expressed in ARVM (A) and NRVM (B) to monitor glucose utilization in living cardiac myocytes. Superimposition of the traces in C illustrates the dramatic difference in the rate of glucose utilization in ARVM and NRVM when glucose efflux is blocked by Cyto B. (E) The dot plot reports all the individual values of half-time of the FRET ratio change associated with glucose utilization obtained in the presence of Cyto B for ARVM and NRVM. The bar plot shows the corresponding effect size (expressed as fold difference), with error bars representing the 95% CIs of that effect size. (D) The dot plot reports all the individual values of initial FRET ratio (reflecting the resting glucose concentration) obtained in ARVM and NRVM. The bar plot shows the corresponding effect size (expressed as algebraic difference), with error bars representing the 95% CIs of that effect size. The results indicate that resting intracellular glucose concentration is much lower in NRVM, which is consistent with a higher glycolytic activity. P-values reported were calculating using bootstrap resampling (see Materials and methods for details).
Figure 6.
Figure 6.
Effects of HKI and HKII overexpression and knockdown on glucose utilization in ARVM and NRVM. (A) In ARVM, overexpression of HKI dramatically increased the rate of glucose utilization (white) compared with control (gray), whereas overexpressing HKII had no significant effect (black). (B) All the individual half-times of the FRET ratio change associated with glucose utilization obtained for the different conditions in ARVM are represented in the dot plot. The bar plot indicates a fivefold decrease (effect size) in the half-time when HKI is overexpressed, while the values are similar to control for HKII overexpression. The error bars represents the 95% CIs of the effect size. (C) In NRVM, however, overexpression of HKI or HKII did not significantly change the half-time of the FRET ratio change associated with glucose utilization (gray, white, and black traces). (D) However, down-regulation of HKI (white), but not HKII (black), dramatically slowed the half-time in NRVM, which suggests that glucose phosphorylation is performed primarily by HKI and not HKII. Down-regulation of HKI and HKII using lentivirus shRNA were assessed by Western blotting and compared with WT and nontargeting shRNA (scr-shRNA) preparations. (E) The dot plot shows that in NRVM, the half-time of FRET ratio change associated with glucose utilization is only affected (2.3-fold increase, effect size in bar plot) when HKI is knocked down, but not by HKII knockdown (KO), or HKI and HKII overexpression (OE). P-values reported were calculated using bootstrap resampling (see Materials and methods for details).

References

    1. Aleshin A.E., Zeng C., Bourenkov G.P., Bartunik H.D., Fromm H.J., Honzatko R.B. 1998. The mechanism of regulation of hexokinase: new insights from the crystal structure of recombinant human brain hexokinase complexed with glucose and glucose-6-phosphate. Structure. 6:39–50 10.1016/S0969-2126(98)00006-9 - DOI - PubMed
    1. Aubert-Foucher E., Font B., Gautheron D.C. 1984. Rabbit heart mitochondrial hexokinase: solubilization and general properties. Arch. Biochem. Biophys. 232:391–399 10.1016/0003-9861(84)90554-X - DOI - PubMed
    1. Burcelin R., Printz R.L., Kande J., Assan R., Granner D.K., Girard J. 1993. Regulation of glucose transporter and hexokinase II expression in tissues of diabetic rats. Am. J. Physiol. 265:E392–E401 - PubMed
    1. Calmettes G., Drummond G.B., Vowler S.L. 2012. Making do with what we have: use your bootstraps. J. Physiol. 590:3403–3406 10.1113/jphysiol.2012.239376 - DOI - PMC - PubMed
    1. Cifuentes D., Martínez-Pons C., García-Rocha M., Galina A., Ribas de Pouplana L., Guinovart J.J. 2008. Hepatic glycogen synthesis in the absence of glucokinase: the case of embryonic liver. J. Biol. Chem. 283:5642–5649 10.1074/jbc.M706334200 - DOI - PubMed

Publication types