. 2014 Feb;95(2):325-36.
doi: 10.1189/jlb.0113013. Epub 2013 Sep 30.

CD8+ dendritic cell-mediated tolerance of autoreactive CD4+ T cells is deficient in NOD mice and can be corrected by blocking CD40L

Affiliations

CD8+ dendritic cell-mediated tolerance of autoreactive CD4+ T cells is deficient in NOD mice and can be corrected by blocking CD40L

Jeffrey D Price et al. J Leukoc Biol. 2014 Feb.

Abstract

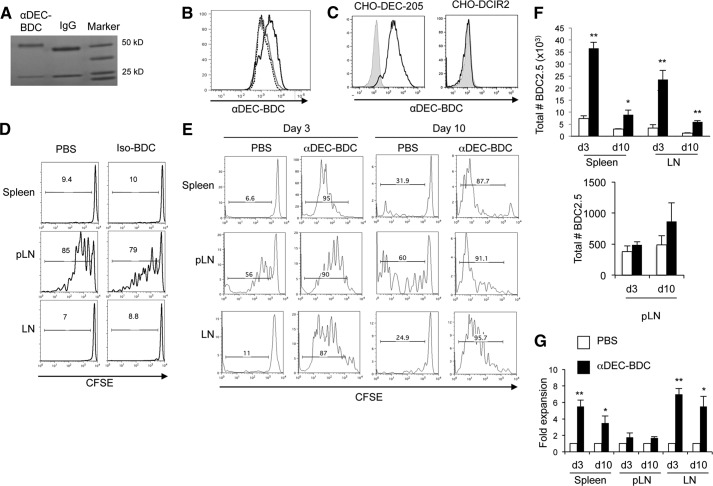
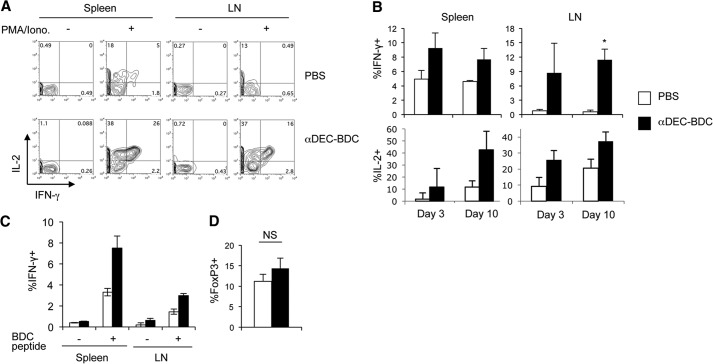
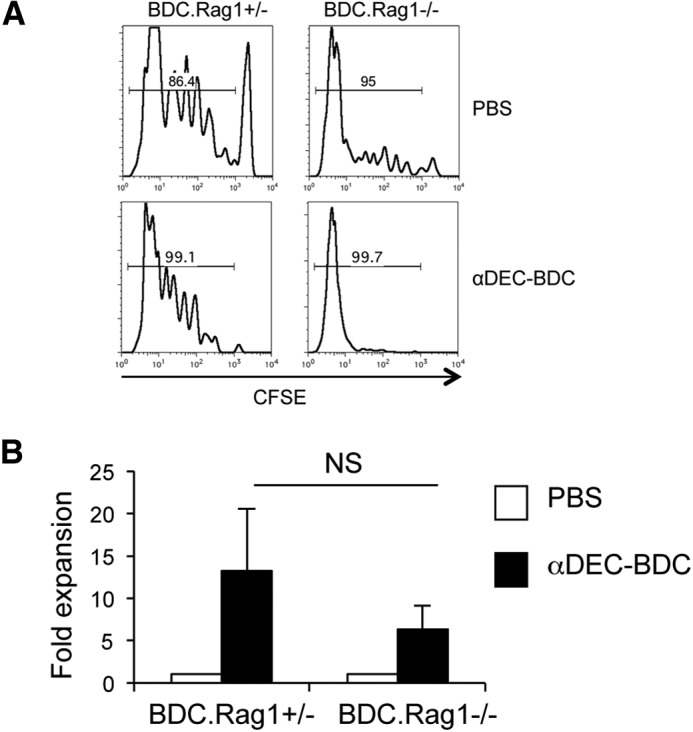
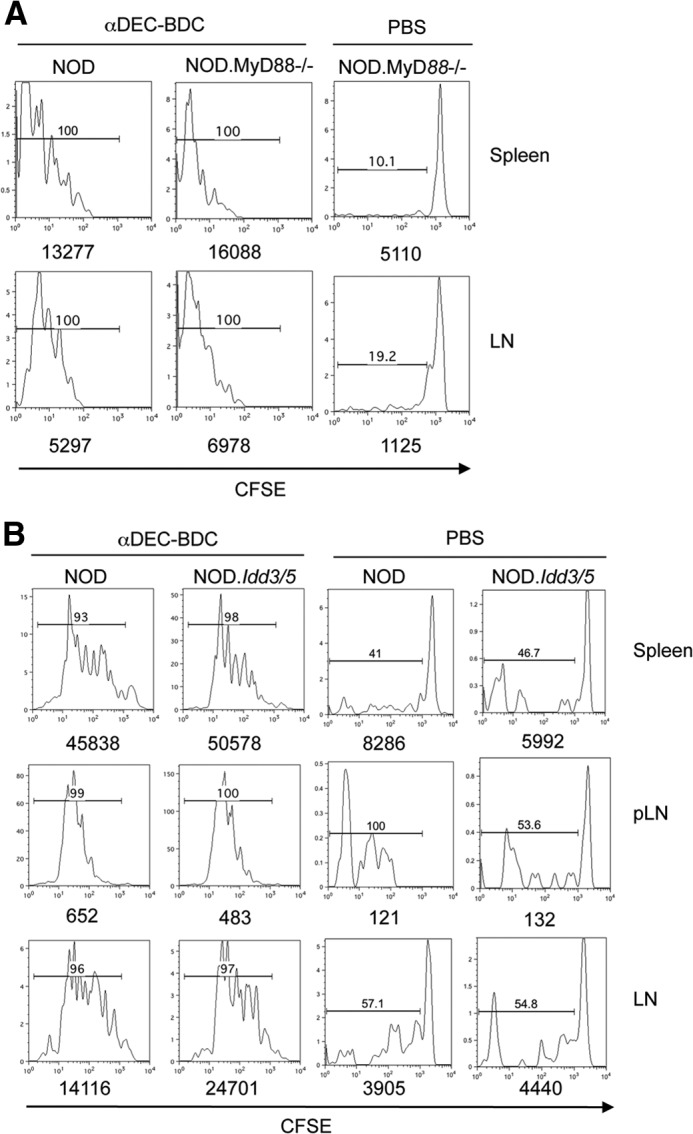
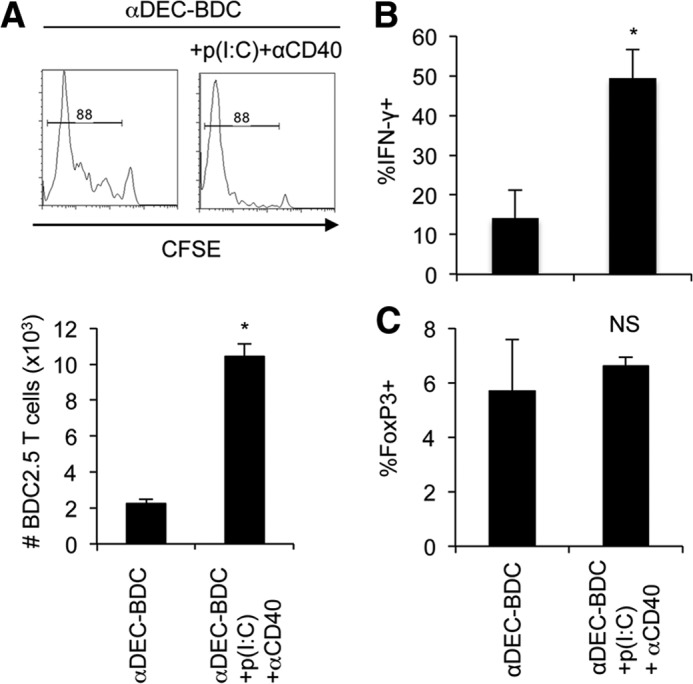
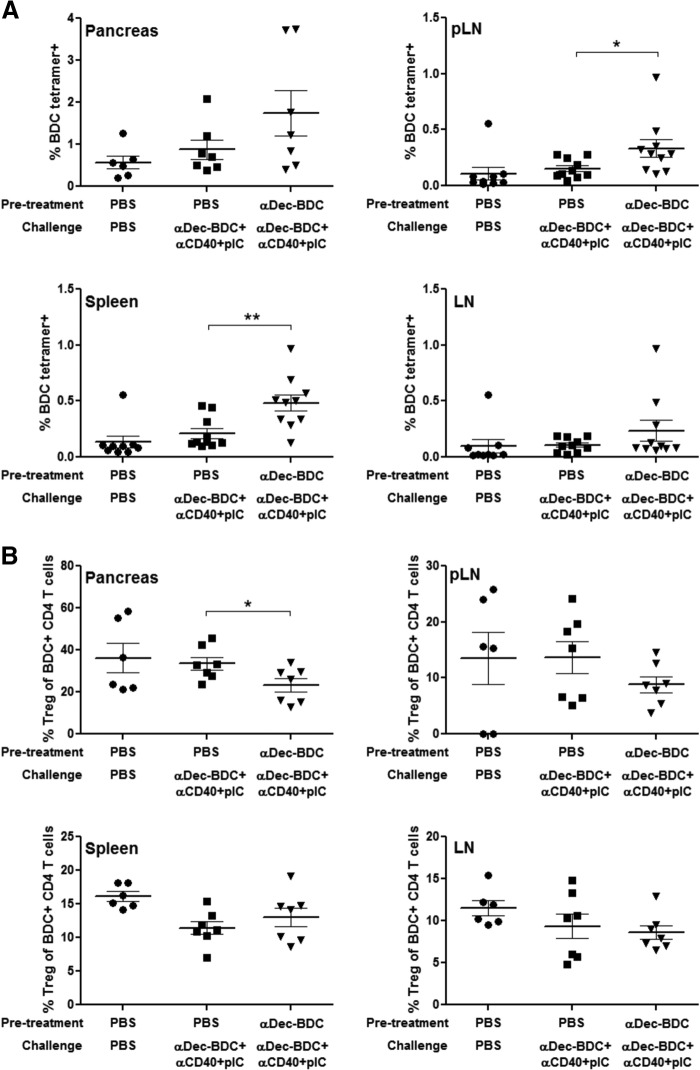
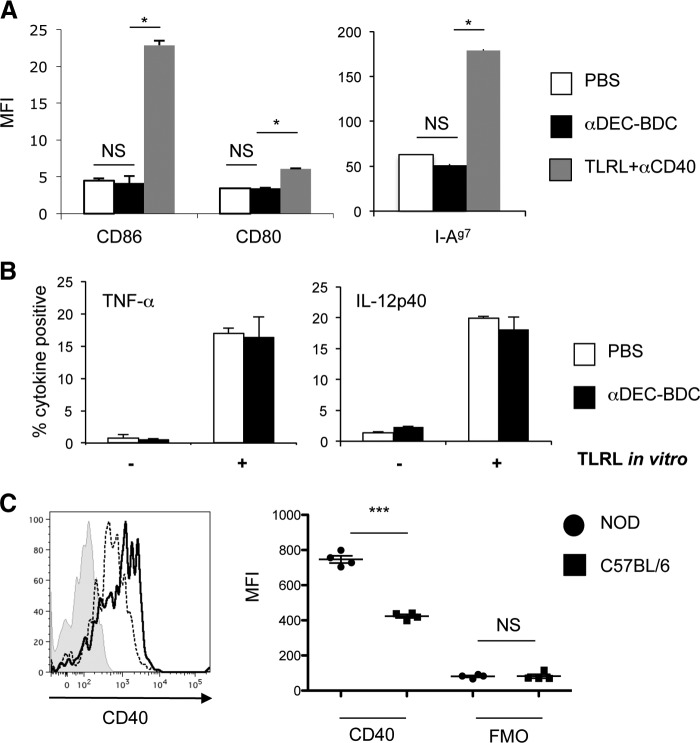
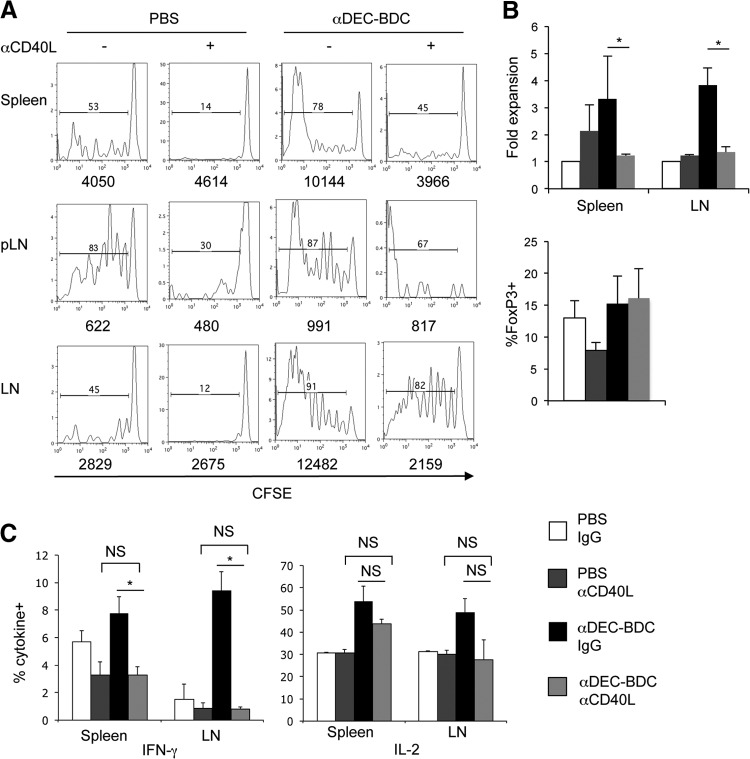
DCs are important mediators of peripheral tolerance for the prevention of autoimmunity. Chimeric αDEC-205 antibodies with attached antigens allow in vivo antigen-specific stimulation of T cells by CD8(+) DCs, resulting in tolerance in nonautoimmune mice. However, it is not clear whether DC-mediated tolerance induction occurs in the context of ongoing autoimmunity. We assessed the role of CD8(+) DCs in stimulation of autoreactive CD4(+) T cells in the NOD mouse model of type 1 diabetes. Targeting of antigen to CD8(+) DCs via αDEC-205 led to proliferation and expansion of β-cell specific BDC2.5 T cells. These T cells also produced IL-2 and IFN-γ and did not up-regulate FoxP3, consistent with an activated rather than tolerant phenotype. Similarly, endogenous BDC peptide-reactive T cells, identified with I-A(g7) tetramers, did not become tolerant after antigen delivery via αDEC-205: no deletion or Treg induction was observed. We observed that CD8(+) DCs from NOD mice expressed higher surface levels of CD40 than CD8(+) DCs from C57BL/6 mice. Blockade of CD40-CD40L interactions reduced the number of BDC2.5 T cells remaining in mice, 10 days after antigen targeting to CD8 DCs, and blocked IFN-γ production by BDC2.5 T cells. These data indicate that the ability of autoreactive CD4(+) T cells to undergo tolerance mediated by CD8(+) DCs is defective in NOD mice and that blocking CD40-CD40L interactions can restore tolerance induction.

Keywords: CD40; DEC-205; peripheral tolerance; type 1 diabetes.


Figures

Figure 1.
Figure 1.. Targeting of a BDC-mimetope peptide to DEC-205+ DCs induces T cell expansion not tolerance.
(A) GelCode Blue staining of SDS-PAGE of αDEC-BDC and control IgG in a reduced gel, showing the increase in size of the chimeric antibody heavy chain (near 50 kDa) as a result of peptide addition. (B) αDEC-BDC staining on CD11c+CD8+ cells (black solid) and CD11c+CD11b+ cells (gray solid) or secondary-only staining on CD11c+CD8+ cells (black dashed) from spleen. (C) αDEC-BDC binding to CHO cells that stably express DEC-205 (left) or DCIR2 (right). (D) CFSE-labeled CD4+ T cells from BDC2.5 Thy1.1+ mice were transferred to NOD mice followed by treatment with PBS or Iso-BDC, and BDC2.5 T cells from lymphoid tissues were analyzed at Day 3. (E) CFSE-labeled CD4+ T cells from BDC2.5 Thy1.1+ mice were transferred to NOD mice followed by treatment with PBS or αDEC-BDC. Spleen, pLNs, and peripheral LNs were recovered at Day 3 or Day 10 after stimulation, and BDC2.5 T cells were assessed for proliferation by CFSE dilution. Histograms are gated on lymphocytes/live cell marker/CD4+/Thy1.1+ cells. Number above the bar indicates the percentage of CFSElo BDC2.5 T cells. (F) Total number of BDC2.5 T cells in spleen, pLN, and LN after PBS or αDEC-BDC at the indicated time-points. (G) Fold expansion of BDC2.5 T cells stimulated by αDEC-BDC compared with unstimulated (PBS-treated) BDC2.5 T cells at the indicated time-points. Proliferation was assessed by the number of CFSElo cells. Data are representative of five (E–G), three (B and C), or two (D) experiments. Error bars represent + sem (F and G). *P < 0.05 compared with PBS control; **P < 0.005 compared with PBS control.
Figure 2.
Figure 2.. BDC2.5 T cells stimulated by CD8+ DCs produce a Th1 effector phenotype and do not convert to Tregs.
(A) Ten days after in vivo stimulation with αDEC-BDC or PBS, BDC2.5 T cells from spleen and LNs were stained intracellularly for IL-2 and IFN-γ, with or without PMA and ionomycin (Iono.) stimulation. Cells are gated on size, a live marker, and CD4+Thy1.1+ cells. (B) Percentage of IFN-γ+ or IL-2+ BDC2.5 T cells after PMA/ionomycin stimulation at the indicated time-points. Average of four independent experiments + sem. (C) Percentage of BDC2.5 T cells in the indicated tissues producing IFN-γ in response to 16 h of in vitro stimulation, with and without antigenic peptide, after 10 days of in vivo stimulation with PBS (white) or αDEC-BDC (black). Average of two independent experiments + sem. (D) Percentage of BDC2.5 T cells that are positive for intracellular FoxP3 in the spleen of PBS-treated (open) or αDEC-BDC-treated (filled) mice after 10 days. Average of three independent experiments + sem. *P < 0.05 compared with PBS control.
Figure 3.
Figure 3.. Monospecific BDC2.5 T cells respond similarly to total BDC2.5 T cells.
(A) CD4+ T cells were obtained from 2-week-old BDC2.5.Rag1+/− and BDC2.5.Rag1−/− mice, transferred to NOD.Thy1.1 mice, and then treated as indicated. After 10 days, LN cells were recovered, and BDC2.5 cell division was assessed by CFSE dilution. Percentage above the histogram is the percent of CFSElo BDC2.5 T cells. (B) Fold expansion of BDC2.5 T cells from Rag1+/− or Rag1−/− mice compared with cell numbers from PBS-treated mice. Data are the average of two experiments + sem.
Figure 4.
Figure 4.. Antigen-targeted CD8+ DCs from NOD.MyD88−/− or NOD.Idd3/5 mice induce similar T cell responses to CD8+ DCs in NOD mice.
(A) BDC2.5 T cells were transferred to NOD or NOD.MyD88−/− mice, followed by PBS or αDEC-BDC treatment. After 10 days, BDC2.5 T cells in spleen and LNs were examined for proliferation based on CFSE dilution. The number above the bar is the percentage of BDC2.5 T cells that are CFSElo. Numbers below the graph are the total number of BDC2.5 T cells. (B) BDC2.5 T cells were transferred into NOD or diabetes-resistant NOD.Idd3/5 mice and then treated as indicated. Spleen, pLN, and LN cells were obtained at Day 10 and assessed for percentages of divided BDC2.5 T cells. Data are each representative of two independent experiments.
Figure 5.
Figure 5.. DC-targeted antigen given with immune stimulation drives further BDC2.5 T cell expansion and effector function.
(A) BDC2.5 T cells were stimulated with αDEC-BDC, with or without poly(I:C) [p(I:C)] and αCD40, in vivo for 10 days. LN cells were isolated and BDC2.5 T cells were assessed for proliferation by dilution of CFSE. Bar graph (lower) indicates total number of BDC2.5 T cells after treatment with αDEC-BDC or αDEC-BDC + poly(I:C) + αCD40. (B) BDC2.5 T cells from A were stimulated with PMA and ionomycin and examined for IFN-γ by intracellular flow cytometry. (C) FoxP3 expression by intracellular flow cytometry was measured. Data are the average of two experiments + sem. *P < 0.05 compared with PBS control. NS, not significant.
Figure 6.
Figure 6.. αDEC-BDC fails to induce tolerance in endogenous CD4 T cells.
NOD mice were injected with PBS or αDEC-BDC, followed by a challenge with αDEC-BDC plus αCD40 and poly(I:C) 7 days later. Three to 4 days following the challenge the pancreas, pLN, LN, and spleen were analyzed for the percentage of BDC/I-Ag7 tetramer-positive cells among CD4+ T cells (A) and the percentage of Tregs (FoxP3+) among tetramer+ CD4+ T cells (B). Each point represents data from a single mouse; data compiled from two or three independent experiments. *P ≤ 0.05; **P ≤ 0.005.
Figure 7.
Figure 7.. CD8+ DCs from NOD mice are not matured by binding αDEC-BDC but do have higher expression of CD40 than DCs from C57BL/6 mice.
(A) NOD mice were treated with PBS, αDEC-BDC, or LPS + poly(I:C) + αCD40 for 12 h. Spleen DCs were recovered, and expression of maturation markers was assessed by flow cytometry for geometric MFI values, as expressed on CD11c+CD8+ DCs. Data are representative of three independent experiments. (B) After in vivo treatment with PBS or αDEC-BDC, splenocytes were cultured for 4 h in the presence or absence of LPS + poly(I:C) and then stained for intracellular cytokines in CD11c+CD8+ DCs. Average of three independent experiments + sem. (C) Expression of the costimulatory molecule CD40 on CD11c+CD8+ spleen DCs from NOD (solid line) and C57BL/6 (dashed line) mice or with isotype control (gray shaded). Each point in graph to the right represents data from a single mouse and shows the geometric MFI of CD40 or FMO control on CD11c+CD8+ DCs. Data are representative of four independent experiments. *P < 0.05; ***P < 0.0005.
Figure 8.
Figure 8.. Inhibiting CD40–CD40L interactions blocks T cell accumulation and cytokine secretion after stimulation by CD8+ DCs.
(A) BDC2.5 T cells were stimulated with PBS or αDEC-BDC and αCD40L or control IgG. Cells from lymphoid tissues were recovered at Day 10 and examined for cell number and proliferation. Numbers above the bar represent the percentage of divided BDC2.5 T cells, whereas numbers below the graph indicate the total number of BDC2.5 T cells in the lymphoid tissues. (B) Fold expansion of BDC2.5 T cells in spleen or LNs (upper) or percentage FoxP3+ of BDC2.5 T cells in spleen (lower) at Day 10 after the indicated stimulation compared with unstimulated cells with control IgG. Data are the average of three independent experiments + sem. *P < 0.05. (C) Cells from treated mice were assessed for IFN-γ and IL-2 production by intracellular flow cytometry. Data are the percent of BDC2.5 T cells positive for the indicated cytokines. Data are the average of three independent experiments + sem. *P < 0.05. NS, not significant.

Similar articles

Cited by

References

    1. Steinman R. M., Hawiger D., Nussenzweig M. C. (2003) Tolerogenic dendritic cells. Ann. Rev. Immunol. 21, 685–711 - PubMed
    1. Turley S. J. (2002) Dendritic cells: inciting and inhibiting autoimmunity. Curr. Opin. Immunol. 14, 765–770 - PubMed
    1. Turley S., Poirot L., Hattori M., Benoist C., Mathis D. (2003) Physiological β cell death triggers priming of self-reactive T cells by dendritic cells in a type-1 diabetes model. J. Exp. Med. 198, 1527–1537 - PMC - PubMed
    1. Hoglund P., Mintern J., Waltzinger C., Heath W., Benoist C., Mathis D. (1999) Initiation of autoimmune diabetes by developmentally regulated presentation of islet cell antigens in the pancreatic lymph nodes. J. Exp. Med. 189, 331–339 - PMC - PubMed
    1. Bluestone J. A., Herold K., Eisenbarth G. (2010) Genetics, pathogenesis and clinical interventions in type 1 diabetes. Nature 464, 1293–1300 - PMC - PubMed

Publication types

MeSH terms