

Trends in 1-year survival of people admitted to hospital in Ontario, 1994-2009
- PMID: 24082022
- PMCID: PMC3826363
- DOI: 10.1503/cmaj.130875
Trends in 1-year survival of people admitted to hospital in Ontario, 1994-2009
Abstract
Background: Changes in the long-term survival of people admitted to hospital is unknown. This study examined trends in 1-year survival of patients admitted to hospital adjusted for improved survival in the general population.
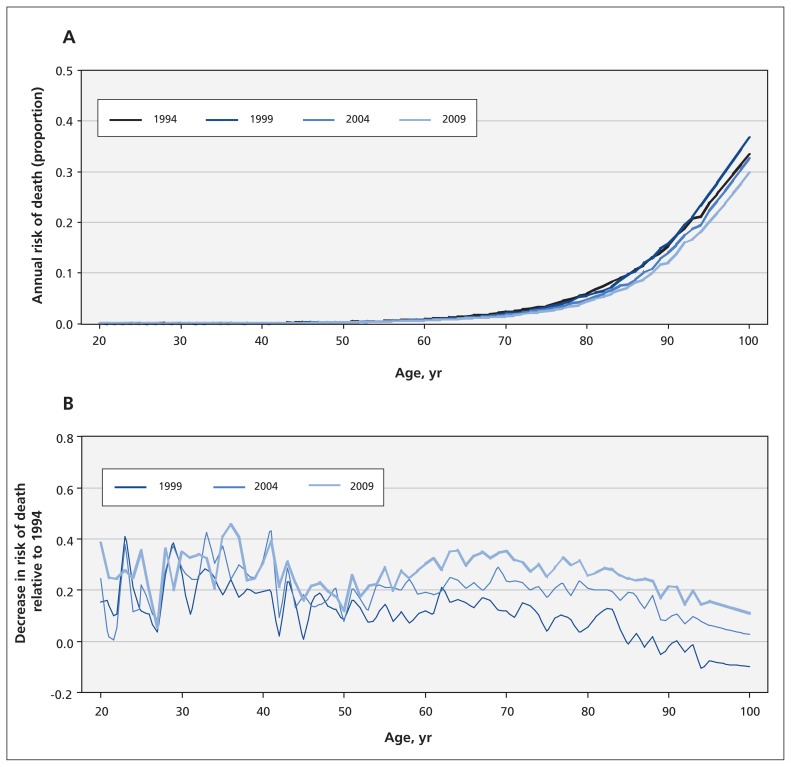
Methods: One-year survival after admission to hospital was determined for all adults admitted to hospital in Ontario in 1994, 1999, 2004, or 2009 by linking to vital statistics datasets. Annual survival in the general population was determined from life tables for Ontario.
Results: Between 1994 and 2009, hospital use decreased (from 8.8% to 6.3% of the general adult population per year), whereas crude 1-year mortality among people with hospital admissions increased (from 9.2% to 11.6%). During this time, patients in hospital became significantly older (median age increased from 51 to 58 yr) and sicker (the proportion with a Charlson comorbidity index score of 0 decreased from 68.2% to 60.0%), and were more acutely ill on admission (elective admissions decreased from 47.4% to 42.0%; proportion brought to hospital by ambulance increased from 16.1% to 24.8%). Compared with 1994, the adjusted odds ratio (OR) for death at 1 year in 2009 was 0.78 (95% confidence interval [CI] 0.77-0.79). However, 1-year risk of death in the general population decreased by 24% during the same time. After adjusting for improved survival in the general population, risk of death at 1 year for people admitted to hospital remained significantly lower in 2009 than in 1994 (adjusted relative excess risk 0.81, 95% CI 0.80-0.82).
Interpretation: After accounting for both the increased burden of patient sickness and improved survival in the general population, 1-year survival for people admitted to hospital increased significantly from 1994 to 2009. The reasons for this improvement cannot be determined from these data.
Figures
References
-
- Anderson GF . In search of value: an international comparison of cost, access and outcomes . Health Aff (Millwood) 1997 . ; 16 : 163 – 71 . - PubMed
-
- Joynt KE , Orav EJ , Jha AK . Mortality rates for Medicare beneficiaries admitted to critical access and non-critical access hospitals, 2002–2010 . JAMA 2013 . ; 309 : 1379 – 87 . - PubMed
-
- Kaboli PJ , Go JT , Hockenberry J , et al. . Associations between reduced hospital length of stay and 30-day readmission rate and mortality: 14-year experience in 129 Veterans Affairs hospitals . Ann Intern Med 2012 . ; 157 : 837 – 45 . - PubMed
Publication types
MeSH terms
LinkOut - more resources
Full Text Sources
Other Literature Sources