Clinical Trial
. 2013 Oct 15;110(42):17107-12.
doi: 10.1073/pnas.1305509110. Epub 2013 Sep 30.

Spatial and temporal codes mediate the tactile perception of natural textures

Affiliations
Clinical Trial

Spatial and temporal codes mediate the tactile perception of natural textures

Alison I Weber et al. Proc Natl Acad Sci U S A. .

Abstract

When we run our fingers over the surface of an object, we acquire information about its microgeometry and material properties. Texture information is widely believed to be conveyed in spatial patterns of activation evoked across one of three populations of cutaneous mechanoreceptive afferents that innervate the fingertips. Here, we record the responses evoked in individual cutaneous afferents in Rhesus macaques as we scan a diverse set of natural textures across their fingertips using a custom-made rotating drum stimulator. We show that a spatial mechanism can only account for the processing of coarse textures. Information about most natural textures, however, is conveyed through precise temporal spiking patterns in afferent responses, driven by high-frequency skin vibrations elicited during scanning. Furthermore, these texture-specific spiking patterns predictably dilate or contract in time with changes in scanning speed; the systematic effect of speed on neuronal activity suggests that it can be reversed to achieve perceptual constancy across speeds. The proposed temporal coding mechanism involves converting the fine spatial structure of the surface into a temporal spiking pattern, shaped in part by the mechanical properties of the skin, and ascribes an additional function to vibration-sensitive mechanoreceptive afferents. This temporal mechanism complements the spatial one and greatly extends the range of tangible textures. We show that a combination of spatial and temporal mechanisms, mediated by all three populations of afferents, accounts for perceptual judgments of texture.

Keywords: neurophysiology; psychophysics; roughness; spike timing; touch.


Conflict of interest statement

The authors declare no conflict of interest.

Figures

Fig. 1.
Fig. 1.
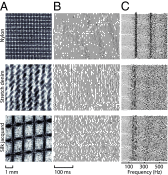
Spatial hypothesis. (A) Surface microstructure (profilometry) of four texture patches. (B) Spatial pattern of activation (spatial event plots; darker colors indicate stronger neural responses) averaged over all of the SA1 afferents in our sample (spatially aligned across afferents). For coarser textures, such as embossed dots and hucktowel, the spatial structure of the stimulus is well preserved. For finer textures, such as nylon and chiffon, evoked responses are not spatially structured. SEPs are normalized for firing rate to highlight their spatial structure. (C) Average spike rate of SA1 afferents for 12 of the 55 textures that spanned the range from fine to coarse, with textures grouped by roughness from finest to roughest. (As there is no objective measure of coarseness, textures were sorted by perceived roughness.) SA1 afferents produce robust responses only to coarse textures. (D) SD of the power spectra of the SEPs derived from SA1 afferent responses, a measure of spatial patterning. SA1 responses to coarse textures are significantly spatially patterned, whereas those for fine textures are not. Asterisks denote SDs that are significantly different from those expected by chance. (E) Mean correlations between SA1 spatial patterning (SEPs) and surface microstructure. The spatial structure of coarse textures is faithfully reflected in the spatial pattern of activation across SA1 afferents, whereas the structure of fine textures is not.
Fig. 2.
Fig. 2.
Responses of one PC afferent to repeated presentations of three textures. (A) Surface microstructure of the three textures. (B) Spike trains elicited over 42 presentations of each texture, with the texture patch progressively displaced along the axis orthogonal to the scanning direction. (C) Power spectrum of the neural response elicited on each trial. Afferent responses to these textures are highly repeatable and temporally patterned along the scanning direction, but there is little to no discernible spatial structure along the orthogonal axis.
Fig. 3.
Fig. 3.
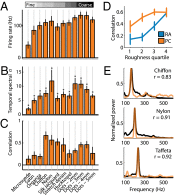
Temporal hypothesis. (A) Average spike rate of PC afferents evoked by 12 of the 55 textures (same textures as in Fig. 1 C–E). PC afferents respond robustly to all textures. (B) SD of the power spectrum derived from PC spike trains. PC responses are significantly temporally patterned for all 12 textures. (C) Mean correlations between the power spectra of skin vibrations, measured using a laser Doppler vibrometer, and those of the responses of individual afferent PC fibers. The temporal structure of PC responses matches that of skin vibrations. (D) Average correlations between vibratory spectra and RA (blue) and PC (orange) population response spectra. The temporal structure of PC responses matches that of skin vibrations across the range of textures, whereas the temporal structure of RA responses matches that of skin vibrations predominantly for coarse textures. (E) Examples of power spectral densities for skin vibrations (black) and PC population responses (orange) for three fine textures.
Fig. 4.
Fig. 4.
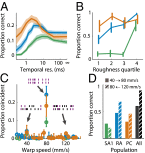
Discriminating textures based on temporal patterning. (A) Mean classification performance over all 55 textures based on the ISI distributions of the responses of individual SA1 (green), RA (blue), and PC (orange) afferents (chance level is ∼1.8%). Shaded areas denote the SEM across afferents. Individual PC afferents convey the most texture information and do so at a temporal resolution of ∼2 ms. (B) Population classification performance for textures grouped into quartiles according to their perceived roughness for the three afferent classes at their respective optimal temporal resolutions. Error bars denote the SEM across all textures in each roughness quartile. Although SA1 afferents perform poorly for smooth textures, classification performance based on RA and PC responses is consistently high across the range of tangible textures. (C) Estimate of the proportion of coincident spikes when afferent responses at 40 and 120 mm/s are contracted or dilated and aligned to the responses at 80 mm/s. Error bars denote the SEM across afferents. Insets illustrate a hypothetical spike pattern at three warping factors: The top spike trains are warped according to speed and compared with the bottom spike train, elicited at the reference speed (80 mm/s); coincident spikes are highlighted in purple. When the amount of contraction or dilation corresponds to the ratio of the speeds, afferent responses evoked by a given texture are similar. In other words, increasing the scanning speed preserves the temporal patterning in afferent responses but contracts it temporally in proportion to the speed. (D) Population classification performance across speeds after warping spike trains collected at 40 (solid bars) and 120 (hatched bars) to 80 mm/s.
Fig. 5.
Fig. 5.
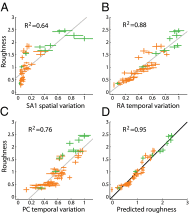
Linking neural responses to perception. (A) SA1 spatial variation plotted against perceived roughness ratings. Green markers denote embossed dot patterns and gratings and orange markers the remaining textures. Error bars denote SEMs across subjects and neurons along the y and x axes, respectively. The line denotes the line of best fit. SA1 spatial variation is a poor predictor of roughness. (B and C) Temporal variation for RA and PC afferents, respectively, plotted against perceived roughness. (D) Combined SA1 spatial variation, and RA and PC temporal variation plotted against perceived roughness. All three predictors contribute significantly to perceived roughness. SEs of the predictors were computed using bootstrapping (Materials and Methods). The solid line indicates unity. Predicted roughness values match the observed ones almost perfectly.

References

    1. Connor CE, Hsiao SS, Phillips JR, Johnson KO (1990) Tactile roughness: Neural codes that account for psychophysical magnitude estimates. J Neurosci 10(12):3823–3836. - PMC - PubMed
    1. Connor CE, Johnson KO (1992) Neural coding of tactile texture: Comparison of spatial and temporal mechanisms for roughness perception. J Neurosci 12(9):3414–3426. - PMC - PubMed
    1. Blake DT, Hsiao SS, Johnson KO (1997) Neural coding mechanisms in tactile pattern recognition: The relative contributions of slowly and rapidly adapting mechanoreceptors to perceived roughness. J Neurosci 17(19):7480–7489. - PMC - PubMed
    1. Yoshioka T, Gibb B, Dorsch AK, Hsiao SS, Johnson KO (2001) Neural coding mechanisms underlying perceived roughness of finely textured surfaces. J Neurosci 21(17):6905–6916. - PMC - PubMed
    1. Johansson RS, Vallbo AB. Tactile sensibility in the human hand: Relative and absolute densities of four types of mechanoreceptive units in glabrous skin. J Physiol. 1979;286:283–300. - PMC - PubMed

Publication types