

Genetic topography of brain morphology
- PMID: 24082094
- PMCID: PMC3801007
- DOI: 10.1073/pnas.1308091110
Genetic topography of brain morphology
Abstract
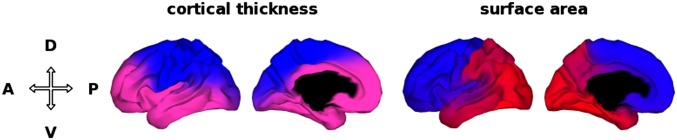
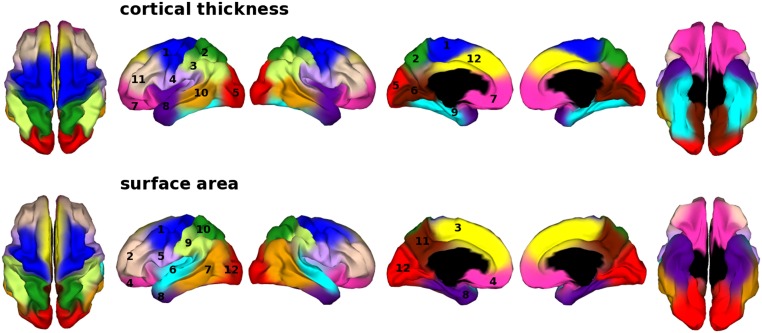
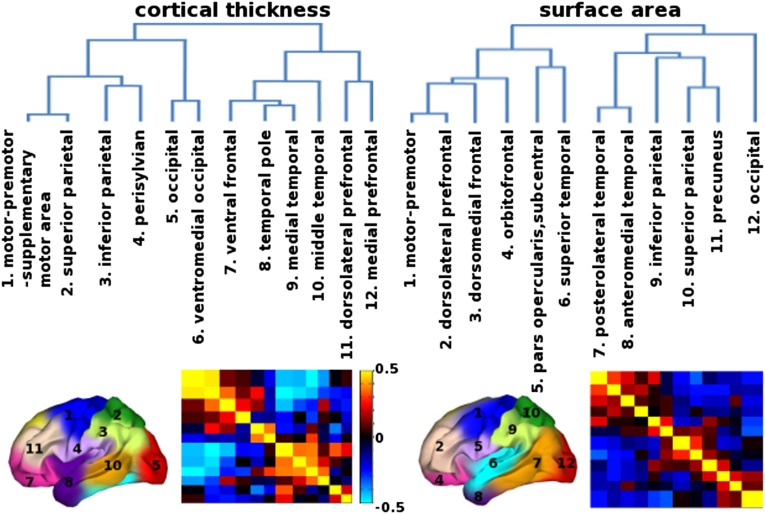
Animal data show that cortical development is initially patterned by genetic gradients largely along three orthogonal axes. We previously reported differences in genetic influences on cortical surface area along an anterior-posterior axis using neuroimaging data of adult human twins. Here, we demonstrate differences in genetic influences on cortical thickness along a dorsal-ventral axis in the same cohort. The phenomenon of orthogonal gradations in cortical organization evident in different structural and functional properties may originate from genetic gradients. Another emerging theme of cortical patterning is that patterns of genetic influences recapitulate the spatial topography of the cortex within hemispheres. The genetic patterning of both cortical thickness and surface area corresponds to cortical functional specializations. Intriguingly, in contrast to broad similarities in genetic patterning, two sets of analyses distinguish cortical thickness and surface area genetically. First, genetic contributions to cortical thickness and surface area are largely distinct; there is very little genetic correlation (i.e., shared genetic influences) between them. Second, organizing principles among genetically defined regions differ between thickness and surface area. Examining the structure of the genetic similarity matrix among clusters revealed that, whereas surface area clusters showed great genetic proximity with clusters from the same lobe, thickness clusters appear to have close genetic relatedness with clusters that have similar maturational timing. The discrepancies are in line with evidence that the two traits follow different mechanisms in neurodevelopment. Our findings highlight the complexity of genetic influences on cortical morphology and provide a glimpse into emerging principles of genetic organization of the cortex.
Keywords: MRI; genetics; regionalization.
Conflict of interest statement
Conflict of interest statement: A.M.D. is a founder of and holds equity in CorTechs Laboratories, Inc., and also serves on its Scientific Advisory Board. The terms of this arrangement have been reviewed and approved by the University of California, San Diego, in accordance with its conflict of interest policies. All other authors report no biomedical financial interests or potential conflicts of interest.
Figures
References
-
- Mountcastle VB. The columnar organization of the neocortex. Brain. 1997;120(Pt 4):701–722. - PubMed
-
- Fukuchi-Shimogori T, Grove EA. Neocortex patterning by the secreted signaling molecule FGF8. Science. 2001;294(5544):1071–1074. - PubMed
-
- Bishop KM, Goudreau G, O’Leary DD. Regulation of area identity in the mammalian neocortex by Emx2 and Pax6. Science. 2000;288(5464):344–349. - PubMed
Publication types
MeSH terms
Grants and funding
- R01 AG031224/AG/NIA NIH HHS/United States
- R01 AG022982/AG/NIA NIH HHS/United States
- R01 AG018386/AG/NIA NIH HHS/United States
- NS056883/NS/NINDS NIH HHS/United States
- R01 AG018384/AG/NIA NIH HHS/United States
- DA029475/DA/NIDA NIH HHS/United States
- U54 NS056883/NS/NINDS NIH HHS/United States
- AG022381/AG/NIA NIH HHS/United States
- AG018384/AG/NIA NIH HHS/United States
- AG031224/AG/NIA NIH HHS/United States
- AG022982/AG/NIA NIH HHS/United States
- AG018386/AG/NIA NIH HHS/United States
- RC2 DA029475/DA/NIDA NIH HHS/United States
- R01 AG022381/AG/NIA NIH HHS/United States
LinkOut - more resources
Full Text Sources
Other Literature Sources
Molecular Biology Databases
