. 2013 Aug 31:4:22.
doi: 10.4103/2153-3539.117448. eCollection 2013.

Eliminating tissue-fold artifacts in histopathological whole-slide images for improved image-based prediction of cancer grade

Affiliations

Eliminating tissue-fold artifacts in histopathological whole-slide images for improved image-based prediction of cancer grade

Sonal Kothari et al. J Pathol Inform. .

Abstract

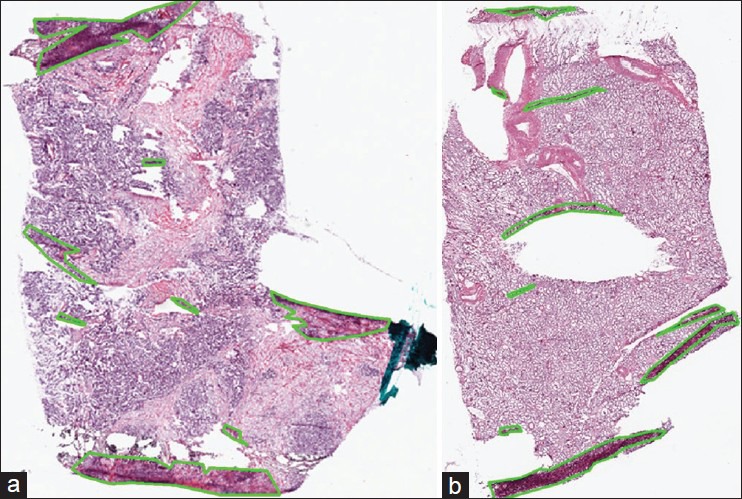
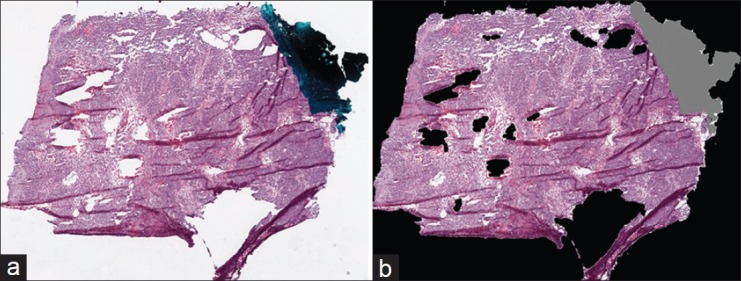
Background: Analysis of tissue biopsy whole-slide images (WSIs) depends on effective detection and elimination of image artifacts. We present a novel method to detect tissue-fold artifacts in histopathological WSIs. We also study the effect of tissue folds on image features and prediction models.

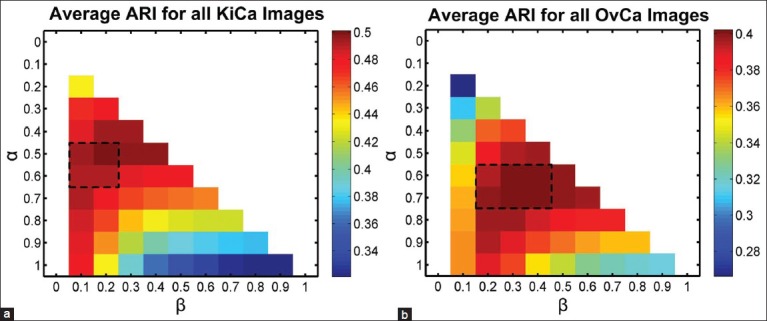
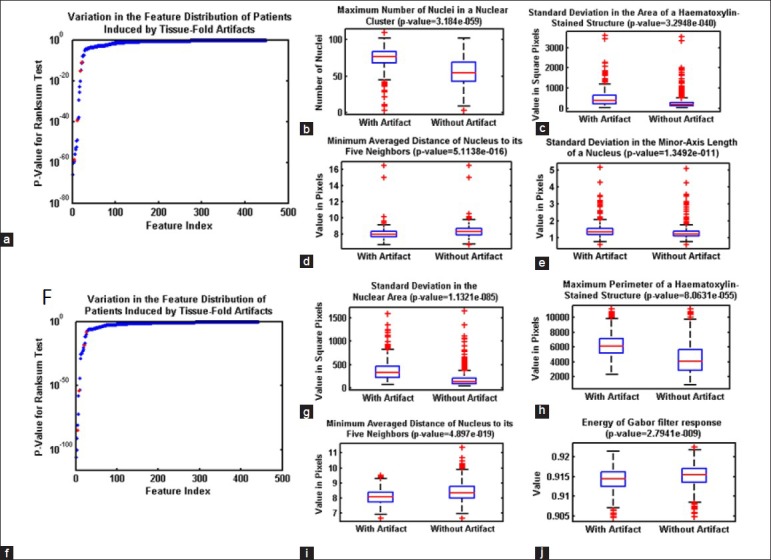
Materials and methods: We use WSIs of samples from two cancer endpoints - kidney clear cell carcinoma (KiCa) and ovarian serous adenocarcinoma (OvCa) - publicly available from The Cancer Genome Atlas. We detect tissue folds in low-resolution WSIs using color properties and two adaptive connectivity-based thresholds. We optimize and validate our tissue-fold detection method using 105 manually annotated WSIs from both cancer endpoints. In addition to detecting tissue folds, we extract 461 image features from the high-resolution WSIs for all samples. We use the rank-sum test to find image features that are statistically different among features extracted from the same set of WSIs with and without folds. We then use features that are affected by tissue folds to develop models for predicting cancer grades.

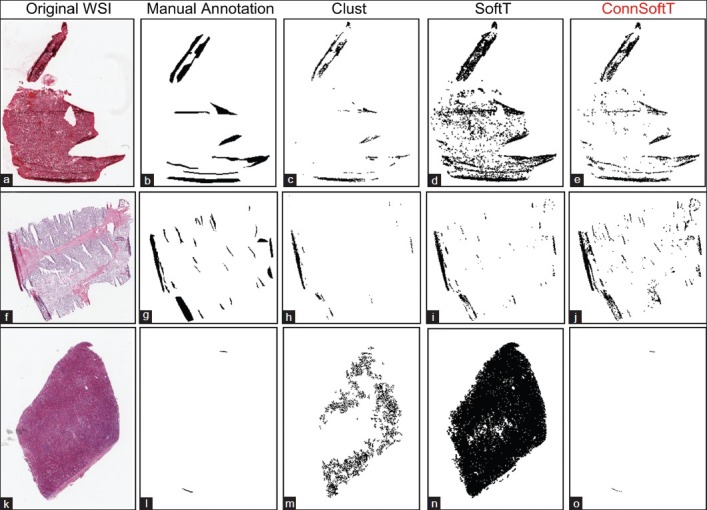
Results: When compared to the ground truth, our method detects tissue folds in KiCa with 0.50 adjusted Rand index (ARI), 0.77 average true rate (ATR), 0.55 true positive rate (TPR), and 0.98 true negative rate (TNR); and in OvCa with 0.40 ARI, 0.73 ATR, 0.47 TPR, and 0.98 TNR. Compared to two other methods, our method is more accurate in terms of ARI and ATR. We found that 53 and 30 image features were significantly affected by the presence of tissue-fold artifacts (detected using our method) in OvCa and KiCa, respectively. After eliminating tissue folds, the performance of cancer-grade prediction models improved by 5% and 1% in OvCa and KiCa, respectively.

Conclusion: The proposed connectivity-based method is more effective in detecting tissue folds compared to other methods. Reducing tissue-fold artifacts will increase the performance of cancer-grade prediction models.

Keywords: Cancer grade prediction; histopathology; image artifacts; tissue folds; whole-slide images.


Figures

Figure 1
Figure 1
Manual annotation of tissue folds in whole-slide images from the cancer genome atlas. Tissue folds marked in WSIs of two types of carcinomas: (a) Ovarian serous adenocarcinoma and (b) kidney renal clear cell carcinoma
Figure 2
Figure 2
Tissue-region detection in a whole-slide image from the cancer genome atlas: (a) original RGB thumbnail and (b) painted thumbnail, in which pen-mark and blank regions are painted gray and black, respectively
Figure 3
Figure 3
Estimation of soft and hard thresholds for detecting tissue folds in the connectivity-based soft threshold method. An example ovarian serous adenocarcinoma whole-slide image (a) has multiple tissue folds detected by manual annotation as shown in a binary mask (b) a difference image (c) is calculated by subtracting intensity from saturation of every pixel in (a). The binary masks obtained by thresholding the difference image at three thresholds − 0.45 (d), − 0.3 (e), and − 0.05 (f) contain connected objects painted by pseudo-colors. The distribution (g) of the number of connected objects at various thresholds is used to calculate optimal thresholds. For parameters α = 0.64 and β = 0.34, the optimal thresholds are thard = − 0.15, and tsoft = − 0.2
Figure 4
Figure 4
Comparison of the performance of the three tissue-fold detection methods: Clustering, Soft threshold, and Connectivity-based soft threshold. Tissue folds detected by the three methods: Clust (c, h, and m), SoftT (d, i, and n), and ConnSoftT (e, j, and o) for an ovarian serous adenocarcinoma whole-slide image (a) and two kidney clear cell carcinoma WSIs (f and k). If tissue folds in a WSI vary in color (a and f), the Clust method under segments. On the other hand, if a WSI has no tissue folds in (k), Clust over segments. Because of the fixed thresholding of the SoftT method, it over segments WSIs (a and k) with darker tissue regions and under segments WSIs (f) with lighter tissue folds
Figure 5
Figure 5
Optimal parameter selection in the Soft threshold (SoftT) and Connectivity-based soft threshold (ConnSoftT) methods. Heat map for the frequency of parameter-pair selection during 50 iterations (5-fold, 10 iterations) of cross-validation for kidney clear cell carcinoma (a and b) and ovarian serous adenocarcinoma (c and d) images. For the SoftT method, the hard and soft thresholds were optimized (a and c). For the ConnSoftT method, α and β were optimized (b and d). Note: In both heatmaps, the parameter space with no selection (zero frequency) has been cropped
Figure 6
Figure 6
Sensitivity of Connectivity-based soft threshold method to parameter selection. Heat map for the average performance (adjusted Rand index) of tissue-fold detection using ConnSoftT method with different parameters. The average was calculated using the entire data set of 105 images for both kidney clear cell carcinoma (a) and ovarian serous adenocarcinoma (b). The performance of the method is quite similar in the range of parameters (marked by a dashed rectangle) selected during cross-validation [Figure 5], indicating that tissue-fold detection is not sensitive to small parameter changes
Figure 7
Figure 7
Effect of tissue-fold elimination on quantitative image features. Variation in quantitative image features in the whole-slide images of kidney clear cell carcinoma (KiCa) (a-e) and ovarian serous adenocarcinoma (OvCa) (f-k) samples in the presence of tissue folds. P values are calculated for all image features to identify features most affected by tissue-folds (ordered by P value of the rank-sum test) for both KiCa (a) and OvCa (f). With the presence of tissue folds, 30 and 53 image features statistically changed in KiCa and OvCA, respectively. Using box-plots, we illustrate the distribution of certain features (highlighted in red) changed by tissue folds
Figure 8
Figure 8
The percent of tissue folds in whole-slide images from the cancer genome atlas. The value on the y-axis represents the percent of tissue tiles eliminated because of tissue folds in samples per patient. Samples for patients with ovarian carcinoma have more tissue folds than those for patients with kidney carcinoma

References

    1. Pantanowitz L, Valenstein PN, Evans AJ, Kaplan KJ, Pfeifer JD, Wilbur DC, et al. Review of the current state of whole slide imaging in pathology. J Pathol Inform. 2011;2:36. - PMC - PubMed
    1. Sadimin ET, Foran DJ. Pathology imaging informatics for clinical practice and investigative and translational research. N Am J Med Sci (Boston) 2012;5:103–9. - PMC - PubMed
    1. Chang H, Fontenay GV, Han J, Cong G, Baehner FL, Gray JW, et al. Morphometic analysis of TCGA glioblastoma multiforme. BMC Bioinformatics. 2011;12:484. - PMC - PubMed
    1. Cooper LA, Kong J, Gutman DA, Wang F, Gao J, Appin C, et al. Integrated morphologic analysis for the identification and characterization of disease subtypes. J Am Med Inform Assoc. 2012;19:317–23. - PMC - PubMed
    1. Cancer Genome Atlas Research Network. Comprehensive genomic characterization defines human glioblastoma genes and core pathways. Nature. 2008;455:1061–8. - PMC - PubMed