

doi: 10.1021/nn404326f.
Epub 2013 Oct 4.
Slow DNA transport through nanopores in hafnium oxide membranes
Affiliations
- PMID: 24083444
- PMCID: PMC4729694
- DOI: 10.1021/nn404326f
Item in Clipboard
Slow DNA transport through nanopores in hafnium oxide membranes
ACS Nano.
.
Abstract
We present a study of double- and single-stranded DNA transport through nanopores fabricated in ultrathin (2-7 nm thick) freestanding hafnium oxide (HfO2) membranes. The high chemical stability of ultrathin HfO2 enables long-lived experiments with <2 nm diameter pores that last several hours, in which we observe >50 000 DNA translocations with no detectable pore expansion. Mean DNA velocities are slower than velocities through comparable silicon nitride pores, providing evidence that HfO2 nanopores have favorable physicochemical interactions with nucleic acids that can be leveraged to slow down DNA in a nanopore.
Figures
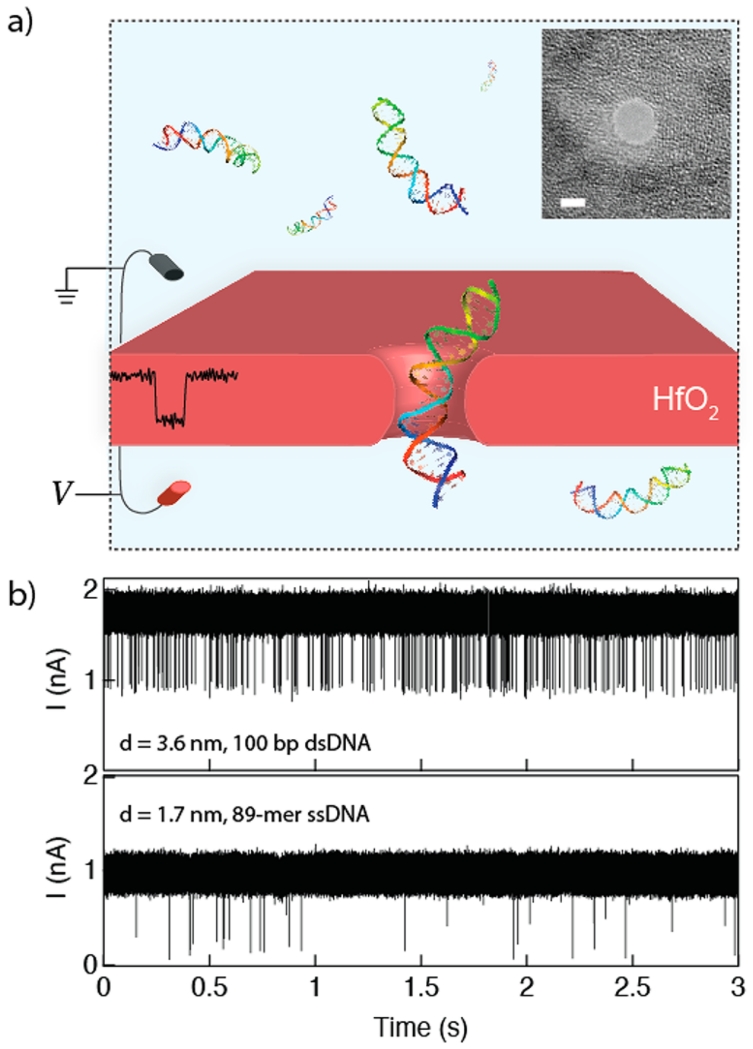
Hafnium oxide nanopores. (a) Cartoon schematic of the experiment. A sample of DNA is placed on the negatively charged electrode side, and ion current through the pore is monitored. Electrophoretic transport of a DNA molecule produces a single spike. Inset shows a transmission electron microscope (TEM) image of a 3.6 nm diameter HfO2 nanopore (scale bar = 2 nm). (b) Continuous 3 s current traces of 100 bp dsDNA (top) and 89-mer ssDNA (bottom) translocating through HfO2 pores at respective biases of V = +175 mV and +150 mV (pore diameters d indicated in the figure).
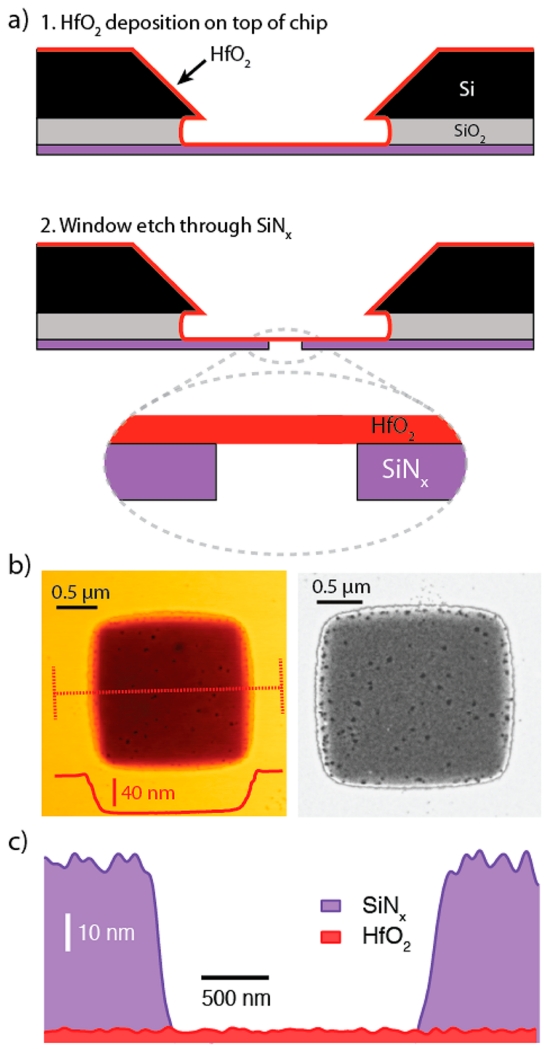
Freestanding HfO2 membrane fabrication. (a) 1. Atomic layer deposition is used to deposit a 3–8 nm thick HfO2 layer onto the trench side of a freestanding silicon nitride (SiNx) window. 2. Reactive ion etching of a predefined window to expose the freestanding HfO2. (b) Atomic force microscopy (AFM) topograph (left) and dark-field scanning transmission electron micrograph (right) of a freestanding HfO2 region. Dashed red line represents line scan that confirms the 50 nm etch step height. (c) Energy dispersive spectroscopy (EDS)-based thickness map of SiNx and HfO2 (thickness estimated from AFM).
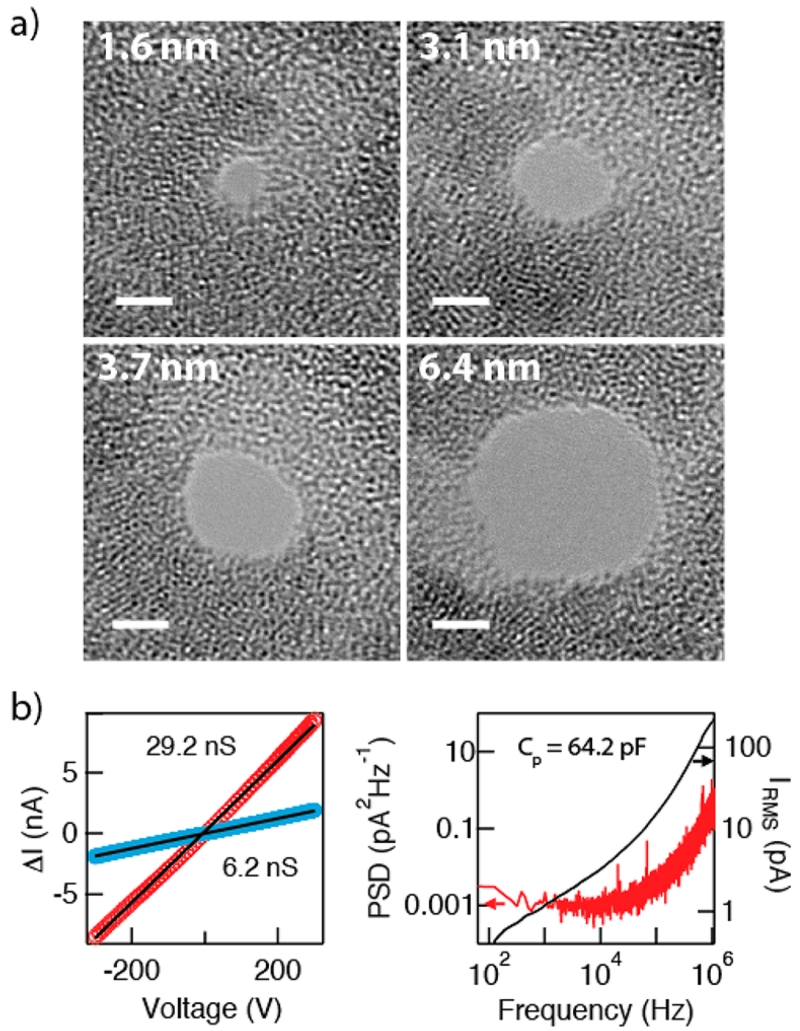
Pore characterization. (a) Bright-field TEM images of nanopores of diameters 1.6–6.4 nm, drilled in a HfO2 membrane. Contrast in the membrane portion of the image is due to thickness variations, a result of e-beam-induced crystallization of the HfO2 film. (b) Current–voltage curves of two HfO2 pores in 1 M KCl buffer, pH 8.0 (d = 5.9 nm, d = 2.0 nm), showing linear conductance. (c) Noise power spectral density (PSD, left axis) and integrated noise (right axis) of a d = 4.0 nm pore at an applied bias of V = 250 mV (range 60–106 Hz). On the basis of the noise spectrum of this pore, we estimate a membrane capacitance of Cp = 64.2 pF.
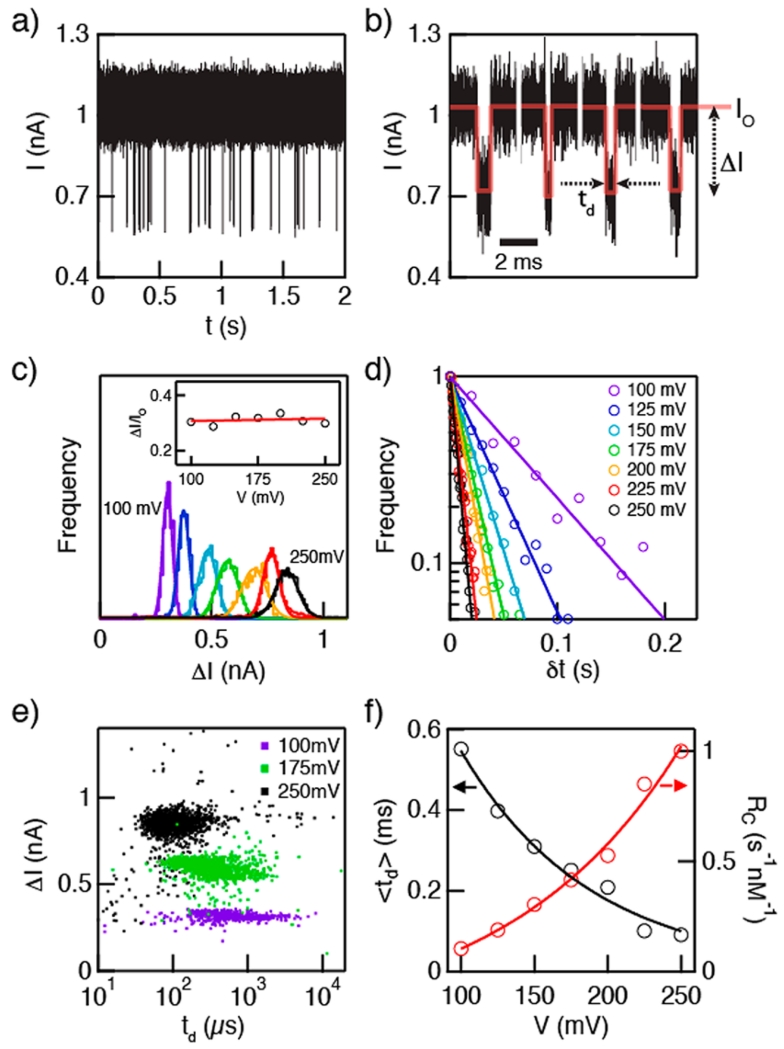
Transport of 150 nM 100 bp double-stranded DNA (dsDNA) through a d = 3.6 nm HfO2 nanopore. (a) Continuous two-second current trace at V = 100 mV. (b) Representative concatenated events following analysis using OpenNanopore software. Each event is defined by its mean current amplitude (ΔI) and dwell time (td). Red line represents square wave fit to each event. (c) Histograms of ΔI at different voltages in the range V = 100–250 mV, showing a regular increase in ΔI with increasing voltage. Inset shows the fractional blockage, ΔI/Io, which is found to be independent of voltage. (d) Distributions of event interarrival times at different voltages (δt). Lines are fits to the distributions, from which the capture rates Rc are extracted. (e) Scatter plots of ΔI vs td for selected voltages. The decrease in spread of td values with increasing voltages exemplifies the transition from diffusion-dominated to drift-dominated transport. (f) Peak td (left axis) and Rc (right axis) values as a function of voltage (see Supporting Information), showing exponential dependence for both parameters (see text).
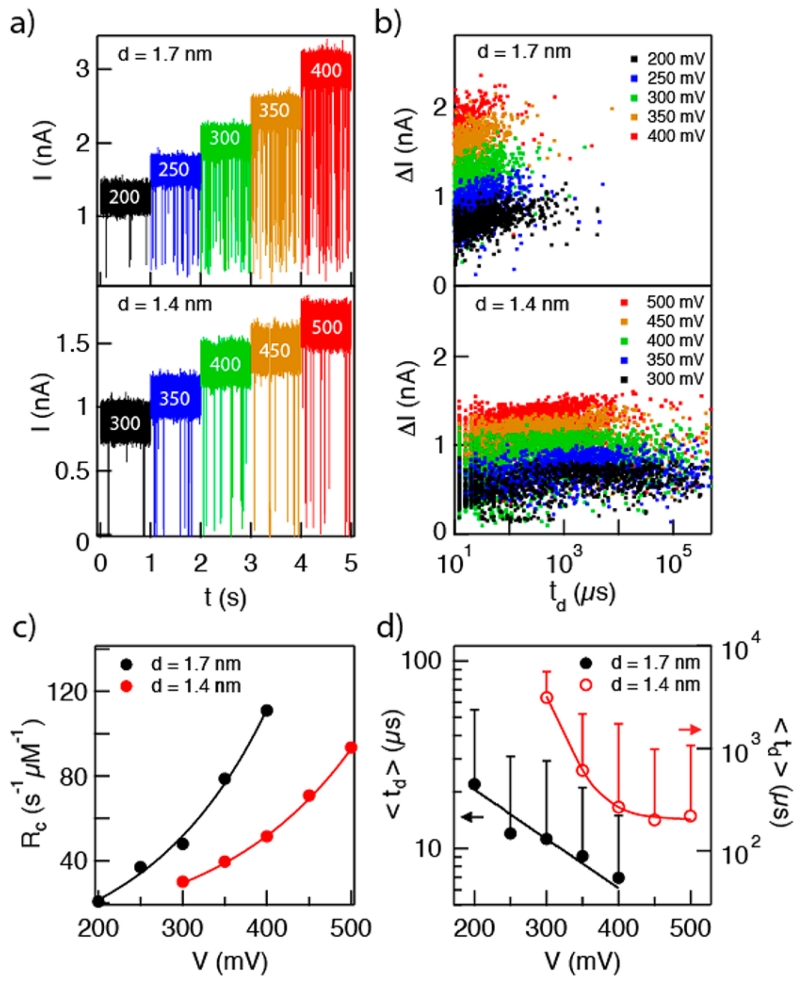
Transport of 89-mer single-stranded DNA (ssDNA) through HfO2 pores with d = 1.4 and 1.7 nm. (a) Continuous current traces at various voltages (indicated in white text on traces). Deep fractional blockades are observed; ΔI/Io = 83% for d = 1.4 nm and 70% for d = 1.7 nm pore. (b) Scatter plots of ΔI vs td demonstrate the impact of a 0.3 nm pore diameter reduction on the spread of dwell times. This strong dependence is evidence of strong interactions between the ssDNA molecule and the HfO2 pore. (c) Normalized capture rates as a function of voltage. Both pores exhibit exponential dependence of event rate on voltage, owing to an energetic barrier for capture into the pores (error bars smaller than markers). (d) Mean dwell times for 1.7 nm pore (left axis) and 1.4 nm pore (right axis). Evidence of strong interactions is seen by the orders of magnitude longer dwell times and wider spread of the distributions (see Supporting Information), as well as the superexponential dependence of dwell times on voltage for the 1.4 nm pore.
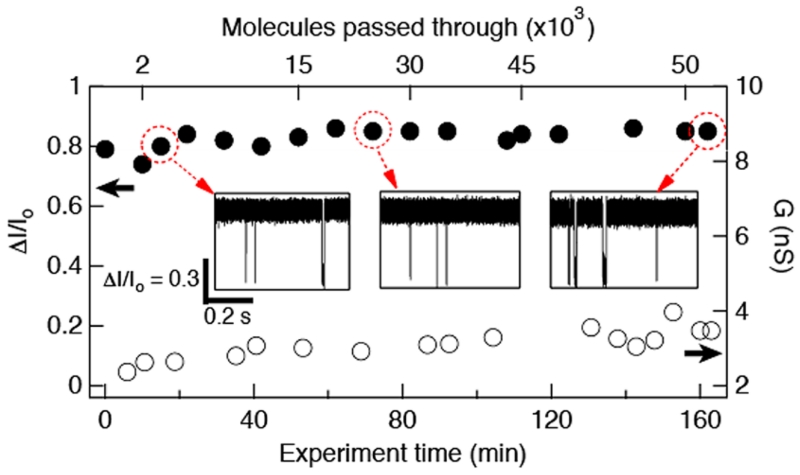
Time stability data for a 1.4 nm diameter HfO2 pore. Plot shows the fractional current blockade ΔI/Io (left axis) as a function of the ~2.5 h experiment time. The pore conductance as a function of time is shown on the right axis. Insets show current traces at different times of the experiment (V = 350 mV). Top axis shows the estimated number of molecules passed through the pore.
References
Publication types
MeSH terms
Substances
Grants and funding
LinkOut - more resources
Full Text Sources
Other Literature Sources
