. 2014 Jan;42(1):485-98.
doi: 10.1093/nar/gkt864. Epub 2013 Sep 30.

The immediate upstream region of the 5'-UTR from the AUG start codon has a pronounced effect on the translational efficiency in Arabidopsis thaliana

Affiliations

The immediate upstream region of the 5'-UTR from the AUG start codon has a pronounced effect on the translational efficiency in Arabidopsis thaliana

Younghyun Kim et al. Nucleic Acids Res. 2014 Jan.

Abstract

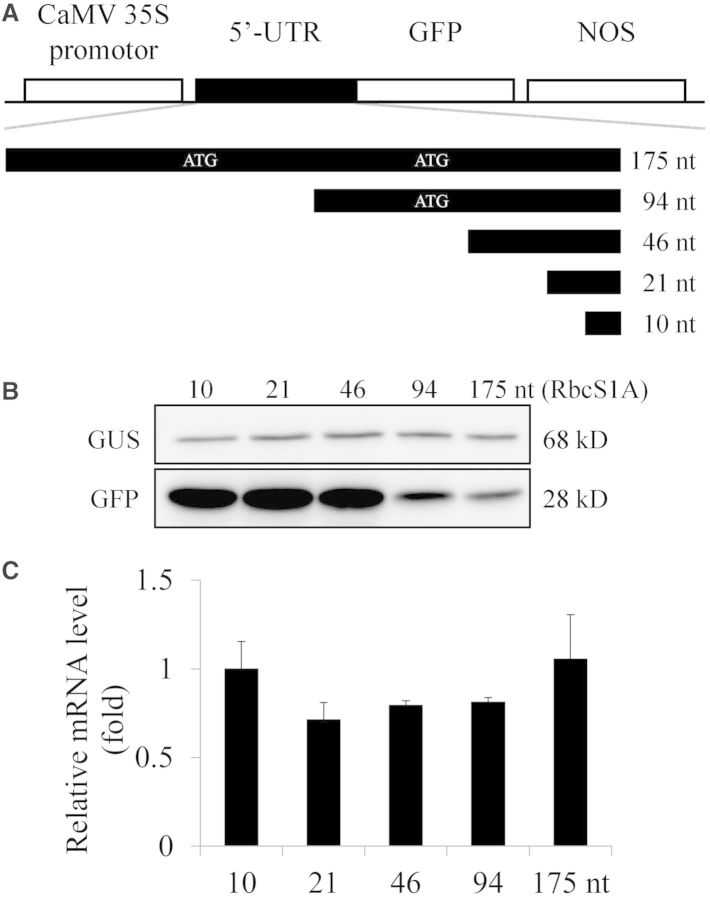
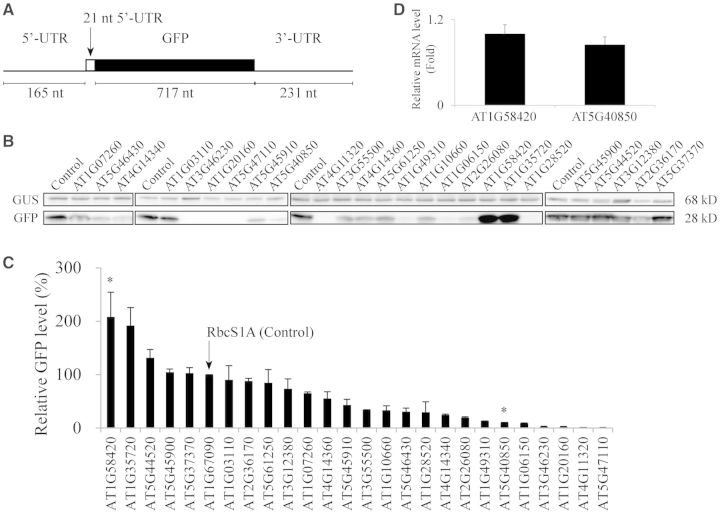
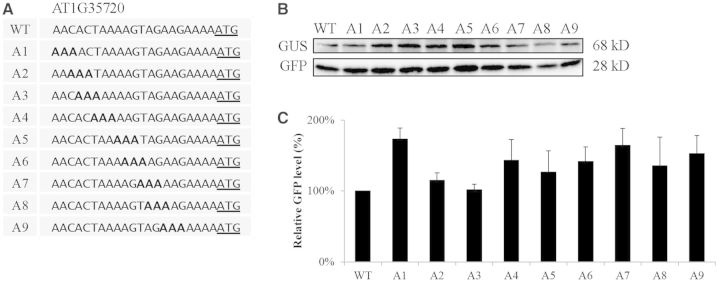
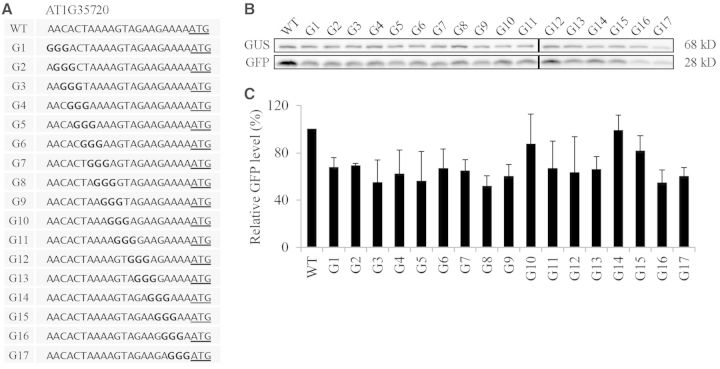
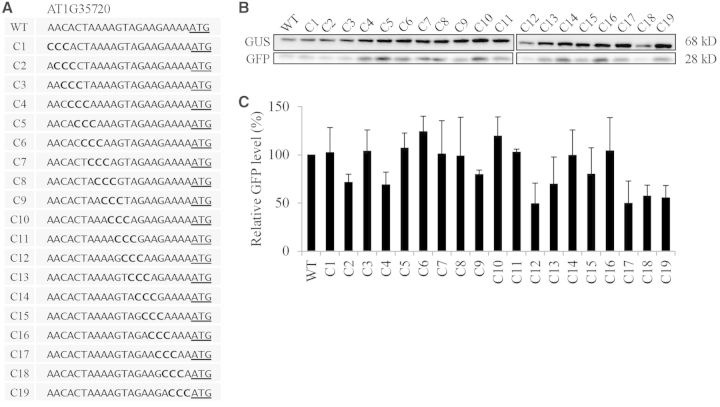
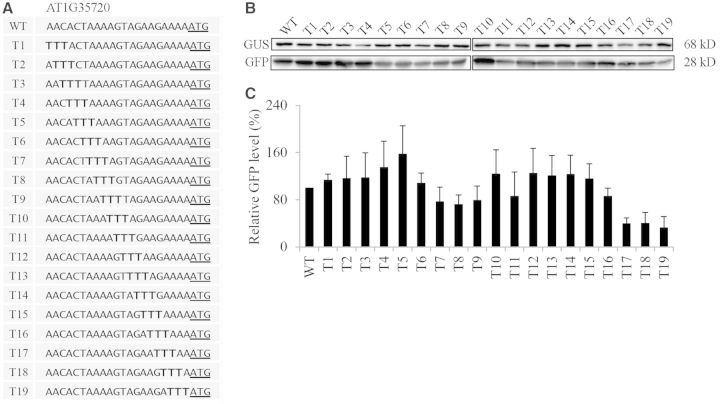
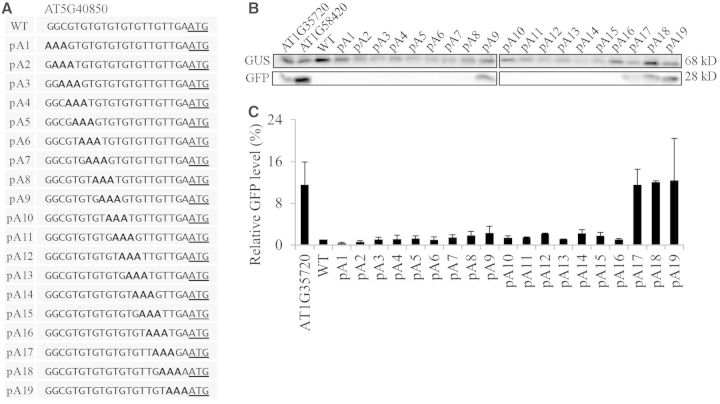
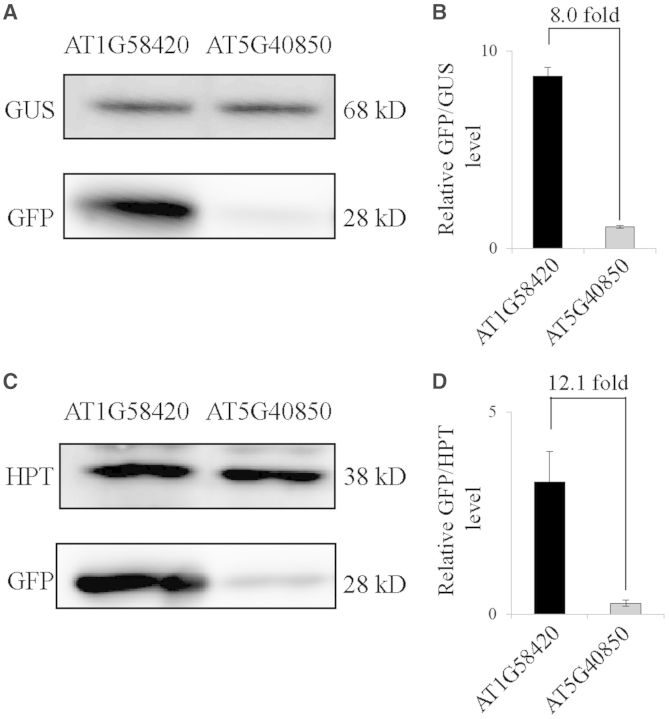
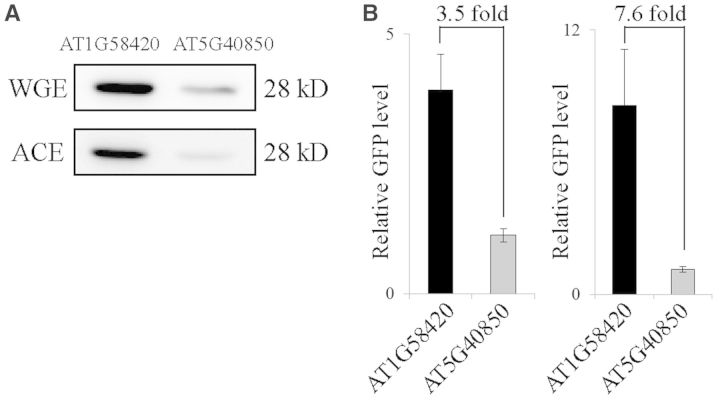
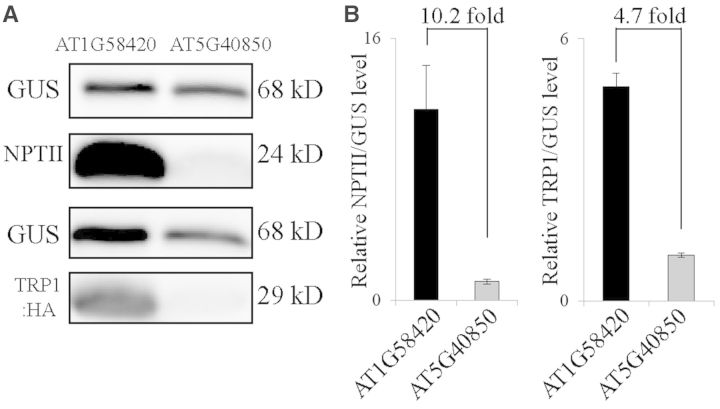
The nucleotide sequence around the translational initiation site is an important cis-acting element for post-transcriptional regulation. However, it has not been fully understood how the sequence context at the 5'-untranslated region (5'-UTR) affects the translational efficiency of individual mRNAs. In this study, we provide evidence that the 5'-UTRs of Arabidopsis genes showing a great difference in the nucleotide sequence vary greatly in translational efficiency with more than a 200-fold difference. Of the four types of nucleotides, the A residue was the most favourable nucleotide from positions -1 to -21 of the 5'-UTRs in Arabidopsis genes. In particular, the A residue in the 5'-UTR from positions -1 to -5 was required for a high-level translational efficiency. In contrast, the T residue in the 5'-UTR from positions -1 to -5 was the least favourable nucleotide in translational efficiency. Furthermore, the effect of the sequence context in the -1 to -21 region of the 5'-UTR was conserved in different plant species. Based on these observations, we propose that the sequence context immediately upstream of the AUG initiation codon plays a crucial role in determining the translational efficiency of plant genes.


Figures

Figure 1.
Figure 1.
The effect of the RbcS1A 5′-UTR length on the translational efficiency. (A) Scheme of serial deletion constructs of the RbcS1A 5′-UTR. Black blocks in the serial deletion mutants represent RbcS1A 5′-UTRs. The length of 5′-UTRs is indicated at the end of each block (175 to 10 nt). The upstream ATG is shown in white. The deletion mutants of the RbcS1A 5′-UTR were placed in front of the GFP AUG codon. NOS, nos-terminator; nt, nucleotide. (B) The translational efficiency of various RbcS1A 5′-UTR::GFP constructs. The full-length or deletion mutants of the RbcS1A 5′-UTR fused to GFP were co-transformed into protoplasts together with a reference construct GUS, and GFP and GUS levels were determined by western blot analysis using anti-GFP and anti-GUS antibodies, respectively. The GUS levels were used to normalize the transformation efficiency. The number indicates the length of the RbcS1A 5′-UTR. (C) qRT-PCR analysis of GFP transcript levels. Total RNA from the transformed protoplasts was subjected to qRT-PCR for GFP and GUS transcripts. The GFP transcript levels were normalized using the co-expressed GUS transcript levels. ACT2 was used as an internal control for qRT-PCR. Error bar, standard deviation (n = 3).
Figure 2.
Figure 2.
The 21 nt region immediately upstream from the AUG start codon of various Arabidopsis genes shows a wide variation in translational efficiency. (A) Schematic presentation of fusion constructs. 5′-UTR, the 5′-untranslated region (165 nts) from the expression vector; 21 nt, 21 nt-long 5′-UTRs from various Arabidopsis genes; GFP-coding region; 3′-UTR, 3′-untranslated region from the expression vector. (B) Translation efficiency of the 5′-UTRs of various Arabidopsis genes. Reporter constructs were introduced into protoplasts together with a reference construct GUS and total protein extracts were subjected to western blot analysis using anti-GFP and anti-GUS antibodies. The 5′-UTR of Rbcs1A was used as a reference for the expression. (C) Quantification of translational efficiency. To quantify the translational efficiency, the signal intensity of immunoblots in (B) was quantified using the multi-gauge software equipped to the LAS3000 (FUJIFILM) and the GFP levels were normalized with the GUS level. (D) Quantification of transcriptional efficiency. To quantify the transcriptional efficiency, total RNA from the protoplasts transformed with two representative 5′-UTR constructs (asterisk in (C)) was used for qRT-PCR using specific primers for the GFP-coding region. The GUS transcript level was used as reference.
Figure 3.
Figure 3.
The secondary structural analysis of the AT1G58420 and AT5G40850 5′-UTRs as representatives of ‘good’ and ‘poor’ 5-UTRs, respectively. (A and B) The entire 5′-UTR consisting of the 165 nt-long 5′-UTR from the expression vector and the 21 nt region of the 5′-UTR from AT1G58420 or AT5G40850 (A), or together with 100 nt GFP-coding region (B) was analysed for the possible secondary structure using centroidfold (http://www.ncrna.org/centroidfold/). Heat colour gradation from blue to red represents the base-pairing probability from 0 to 1. The base-pairing probability is the probability that a pair of bases forms a base pair via hydrogen bonds in the secondary structure. The 21 nt 5′-UTRs from AT1G58420 and AT5G40850 are in capital letters and also indicated by broken lines.
Figure 4.
Figure 4.
The A nucleotides introduced in the AT1G35720 5′-UTR are generally favourable for translational efficiency. (A) Sequences of triple A substitution mutants. Three nucleotides were sequentially substituted with three As in the 21 nt region of the AT1G35720 5′-UTR. (B) The effect of triple A substitutions on the translational efficiency. The mutant constructs of the AT1G35720 5′-UTR were co-transformed into protoplasts together with a GUS construct and protein extracts were subjected to western blot analysis using anti-GFP and anti-GUS antibodies. (C) Quantification of the translational efficiency. To quantify the translational efficiency, the signal intensity of immunoblots in (B) was quantified using the multi-gauge software equipped to the LAS3000 (FUJIFILM) and the GFP levels were normalized with the GUS levels. Error bar, standard deviation (n = 3).
Figure 5.
Figure 5.
Triple G substitutions in the AT1G35720 5′-UTR largely cause a decrease in the translation efficiency. (A) Sequences of triple G substitution mutants. Three nucleotides were sequentially substituted with three Gs in the 21 nt region of the AT1G35720 5′-UTR. (B) The effect of triple G substitutions on the translational efficiency. The mutant constructs of the AT1G35720 5′-UTR were co-transformed into protoplasts together with a GUS construct and protein extracts were subjected to western blot analysis using anti-GFP and anti-GUS antibodies. (C) Quantification of the translational efficiency. To quantify the translational efficiency, the signal intensity of the immunoblots shown in (B) was quantified using the multi-gauge software equipped to the LAS3000 (FUJIFILM) and the GFP levels were normalized with the GUS levels. Error bar, standard deviation (n = 3).
Figure 6.
Figure 6.
Triple C substitutions in the AT1G35720 5′-UTR cause suppression of the translational efficiency in a position-dependent manner. (A) Sequences of triple C substitution mutants. Three nucleotides were sequentially substituted with three Cs in the 21 nt region of the AT1G35720 5′-UTR. (B) The effect of triple C substitutions on the translational efficiency. The mutant constructs of the AT1G35720 5′-UTR were co-transformed into protoplasts together with a GUS construct and protein extracts were subjected to western blot analysis using anti-GFP and anti-GUS antibodies. (C) Quantification of the translational efficiency. To quantify the translational efficiency, the signal intensity of immunoblots in (B) was quantified using the multi-gauge software equipped to the LAS3000 and the GFP levels were normalized with the GUS levels. Error bar, standard deviation (n = 3).
Figure 7.
Figure 7.
Triple T substitutions in the AT1G35720 5′-UTR cause a strong suppression or activation of the translational efficiency in a position-dependent manner. (A) Sequences of triple T substitution mutants. Three nucleotides were sequentially substituted with three Ts in the 21 nt region of the AT1G35720 5′-UTR. (B) The effect of triple T substitutions on the translational efficiency. The mutant constructs of the AT1G35720 5′-UTR were co-transformed into protoplasts together with a GUS construct and protein extracts were subjected to western blot analysis using anti-GFP and anti-GUS antibodies. (C) Quantification of the translational efficiency. To quantify the translational efficiency, the signal intensity of the immunoblots in (B) was quantified using the multi-gauge software equipped to the LAS3000 and the GFP levels were normalized with the GUS levels. Error bar, standard deviation (n = 3).
Figure 8.
Figure 8.
Triple A substitutions in the region from positions −1 to −5 of the AT1G04850 5′-UTR cause a strong enhancement of translational efficiency. (A) Sequences of triple A substitutions in the 21 nt region of the AT1G04850 5′-UTR. Three nucleotides were sequentially substituted with three As and the resulting constructs were fused to GFP. (B) Translational efficiency of triple A substitution mutants. The wild-type AT1G04850 5′-UTR and its triple A substitution mutant constructs were introduced into protoplasts together with a GUS construct and expression levels of GFP and GUS were examined by western blot analysis using anti-GFP and anti-GUS antibodies, respectively. (C) Quantification of the GFP expression levels. The GFP levels were normalized using the GUS levels. Error bar, standard deviation (n = 3). The GFP level of the AT1G35720 5′-UTR construct was used as a control to compare elevated translational efficiency of pA17-pA19.
Figure 9.
Figure 9.
The effect of the 5′-UTRs on the translational efficiency is conserved in different plant species. (A) GFP levels in Arabidopsis protoplasts. Reporter constructs of the AT1G58420 or AT1G04850 5′-UTRs were co-transformed into Arabidopsis protoplasts together with a GUS construct and the expression levels of GFP and GUS were determined by western blot analysis using anti-GFP and anti-GUS antibodies, respectively. (B) Quantification of translational efficiency. To quantify the translational efficiency, the signal intensity of the immunoblots in (A) was quantified using the multi-gauge software equipped to the LAS3000 and the GFP levels were normalized using the GUS levels. Error bar, standard deviation (n = 3). (C) GFP levels in tobacco leaf tissues. The GFP constructs with the 21 nt region of AT1G58420 or AT1G04850 5′-UTRs in a binary vector were transformed into Nicotiana benthamiana leaf tissues by Agrobacterium-mediated infiltration. The expression levels of GFP and HPT were determined by western blot analysis using anti-GFP and anti-HPT antibodies, respectively. HPT was used to normalize the transformation efficiency. (D) Quantification of translational efficiency. To quantify the translational efficiency, the signal intensity of the immunoblot in (C) was quantified using the multi-gauge software equipped to the LAS3000 and the GFP levels were normalized using the HPT levels. Error bar, standard deviation (n = 3).
Figure 10.
Figure 10.
The effect of the 5′-UTRs on the translational efficiency is independent of the translational system. (A) Western blot analysis of GFP levels. The AT1G58420 5′-UTR or AT1G04850 5′-UTR constructs were in vitro transcribed and 17 ng (50 fmol) of their transcripts were used for in vitro translation using ACE or wheat germ extracts. The expression levels of GFP were determined by western blot analysis using anti-GFP antibody. (B) Quantification of GFP levels. To quantify the translational efficiency, the signal intensity of the immunoblots in (A) was quantified using the multi-gauge software equipped to the LAS3000. Error bar, standard deviation (n = 3).
Figure 11.
Figure 11.
The effect of the 5′-UTRs on the translational efficiency is independent of the downstream coding region. (A) Western blot analysis of expressed proteins. The indicated 5′-UTR constructs were co-transformed into protoplasts together with a GUS construct and the expression of NPTII and TRP1:HA was determined by western blot analysis using anti-NTPII and anti-HA antibodies, respectively. In addition, GUS levels were detected with anti-GUS antibody. (B) Quantification of the translational efficiency. To quantify the translational efficiency, the signal intensity of the immunoblots in (A) was quantified using the multi-gauge software equipped to the LAS3000 and the NPTII and TRP1:HA levels were normalized using the GUS levels. Error bar, standard deviation (n = 3).

References

    1. van der Velden AW, Thomas AA. The role of the 5′ untranslated region of an mRNA in translation regulation during development. Int. J. Biochem. Cell. Biol. 1999;31:87–106. - PubMed
    1. Bashirullah A, Cooperstock RL, Lipshitz HD. Spatial and temporal control of RNA stability. Proc. Natl Acad. Sci. USA. 2001;98:7025–7028. - PMC - PubMed
    1. Jansen RP. mRNA localization: message on the move. Nat. Rev. Mol. Cell. Biol. 2001;2:247–256. - PubMed
    1. Wilkie GS, Dickson KS, Gray NK. Regulation of mRNA translation by 5′- and 3′-UTR-binding factors. Trends Biochem. Sci. 2003;28:182–188. - PubMed
    1. Jackson RJ, Hellen CU, Pestova TV. The mechanism of eukaryotic translation initiation and principles of its regulation. Nat. Rev. Mol. Cell. Biol. 2010;11:113–127. - PMC - PubMed

Publication types