. 2013 Nov;123(11):4799-808.
doi: 10.1172/JCI70710.

FGF19 action in the brain induces insulin-independent glucose lowering

FGF19 action in the brain induces insulin-independent glucose lowering

Gregory J Morton et al. J Clin Invest. 2013 Nov.

Abstract

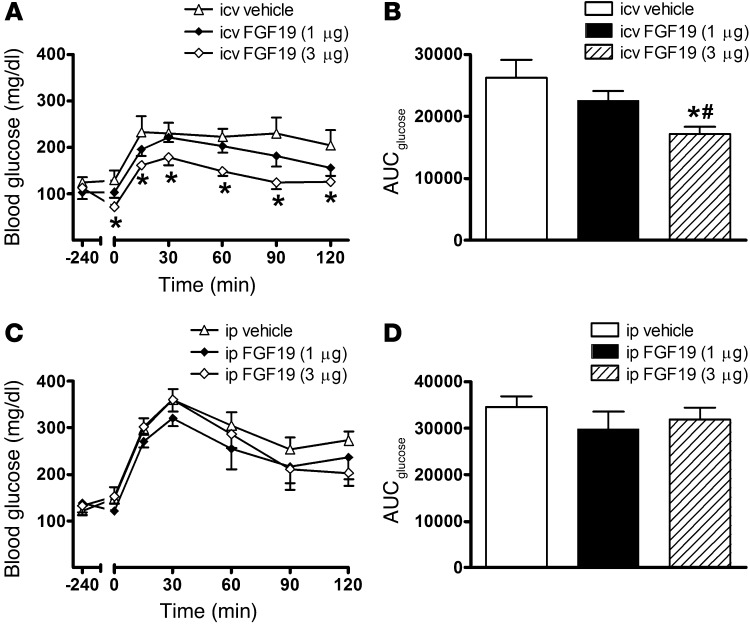
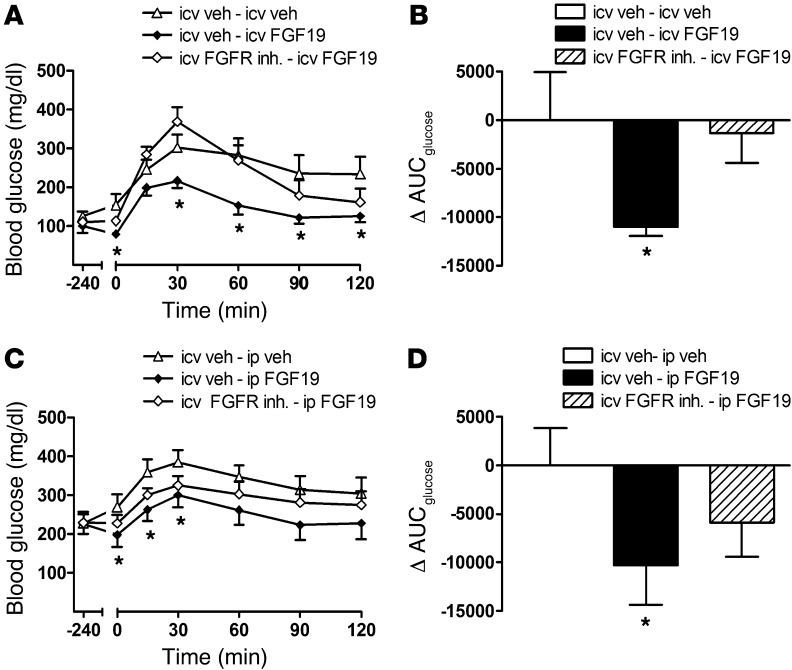
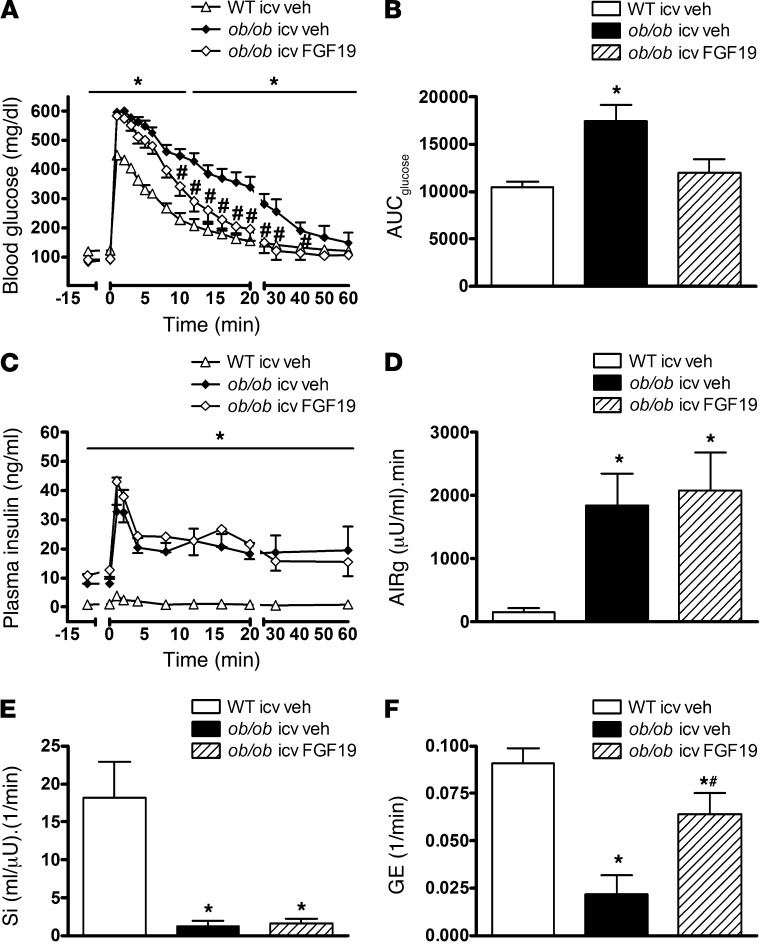
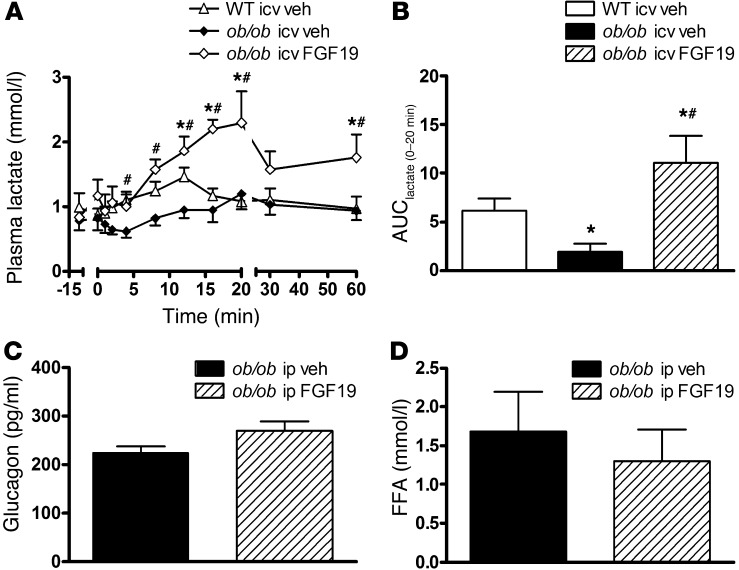
Insulin-independent glucose disposal (referred to as glucose effectiveness [GE]) is crucial for glucose homeostasis and, until recently, was thought to be invariable. However, GE is reduced in type 2 diabetes and markedly decreased in leptin-deficient ob/ob mice. Strategies aimed at increasing GE should therefore be capable of improving glucose tolerance in these animals. The gut-derived hormone FGF19 has previously been shown to exert potent antidiabetic effects in ob/ob mice. In ob/ob mice, we found that systemic FGF19 administration improved glucose tolerance through its action in the brain and that a single, low-dose i.c.v. injection of FGF19 dramatically improved glucose intolerance within 2 hours. Minimal model analysis of glucose and insulin data obtained during a frequently sampled i.v. glucose tolerance test showed that the antidiabetic effect of i.c.v. FGF19 was solely due to increased GE and not to changes of either insulin secretion or insulin sensitivity. The mechanism underlying this effect appears to involve increased metabolism of glucose to lactate. Together, these findings implicate the brain in the antidiabetic action of systemic FGF19 and establish the brain’s capacity to rapidly, potently, and selectively increase insulin-independent glucose disposal.


Figures

Figure 1
Figure 1. Effect on glucose tolerance of a single injection FGF19 given either centrally or systemically to ob/ob mice.
(A and C) Glucose tolerance (0.5 g/kg) and (B and D) the integrated area under the glucose curve (AUCglucose) in leptin-deficient ob/ob animals that received either a single, acute i.c.v. or i.p. injection of FGF19 at either 1 or 3 μg or its vehicle. Data represent mean ± SEM. *P < 0.05 vs. i.c.v. vehicle. #P < 0.05 vs. i.c.v. FGF19 (1 μg).
Figure 2
Figure 2. Effect of a centrally administered FGF receptor blocker on the glucose-lowering effect of FGF19.
(A and C) Glucose tolerance (0.5 g/kg) and (B and D) the change in the integrated area under the glucose curve in leptin-deficient ob/ob mice that received either an i.c.v. pretreatment injection of the FGFR inhibitor, PD173074 (25 μg), or its vehicle (veh) 1-hour prior to either systemic or central administration of FGF19 or its vehicle. Animals were then subject to an ipgtt (0.5 g/kg) 90 minutes later. Data represent mean ± SEM. *P < 0.05 vs. i.c.v. vehicle–i.c.v./i.p. vehicle.
Figure 3
Figure 3. Effect of FGF19 on determinants of glucose tolerance in ob/ob mice.
(A) Blood glucose, (B) the integrated area under the glucose curve, (C) plasma insulin levels, (D) the acute insulin response to glucose (AIRg), (E) Si, and (F) GE in ob/ob mice or littermate controls that received either i.c.v. vehicle or FGF19 (3 μg) and were subjected to a frequently sampled glucose tolerance test. Data represent mean ± SEM. *P < 0.05 vs. WT i.c.v. vehicle; #P < 0.05 vs. ob/ob i.c.v. vehicle.
Figure 4
Figure 4. Effect of FGF19 on plasma glucagon, FFA, and lactate levels in ob/ob mice.
(A) Plasma lactate levels and (B) the integrated area under the lactate curve (AUClactate) during the first 20 minutes of the same FSIGT performed in WT and ob/ob mice that received either i.c.v. vehicle or FGF19 shown in Figure 3. (C) Plasma glucagon and (D) FFA levels in ob/ob mice treated with FGF19 (1 mg/kg i.p.) or its vehicle, followed 90 minutes later by an i.p. glucose bolus. Glucagon and FFA levels were measured in plasma obtained 30 minutes after the glucose bolus. Data represent mean ± SEM. *P < 0.05 vs. WT i.c.v. vehicle; #P < 0.05 vs. ob/ob i.c.v. vehicle.
Figure 5
Figure 5. Hepatic effects of i.c.v.
FGF19 in ob/ob mice. Hepatic expression of (A) G6Pase and (B) Pepck using real-time PCR and (C) liver triglyceride and (D) liver glycogen content in leptin-deficient ob/ob animals that received daily i.c.v. injections of either FGF19 (3 μg) or its vehicle. Data represent mean ± SEM. *P < 0.05 vs. i.c.v. vehicle.
Figure 6
Figure 6. Central targets of FGF19 action.
(A and B) Immunodetection of POMC (green) and the colocalization of c-fos in POMC neurons in Pomc-Tau-GFP mice treated with i.c.v. administration of either (A) vehicle or (B) FGF19 (original magnification, ×20; Scale bar: 20 μm). (C) Glucose tolerance (0.5 g/kg) and (D) the integrated area under the glucose curve in Mc4r–/–mice that received a single, acute i.c.v. injection of FGF19 (3 μg) or its vehicle. Data represent mean ± SEM. *P < 0.05 vs. i.c.v. vehicle. 3V, third ventricle.

References

    1. Best JD, Kahn SE, Ader M, Watanabe RM, Ni TC, Bergman RN. Role of glucose effectiveness in the determination of glucose tolerance. Diabetes Care. 1996;19(9):1018–1030. - PubMed
    1. Alonso LC, et al. Simultaneous measurement of insulin sensitivity, insulin secretion, and the disposition index in conscious unhandled mice. Obesity (Silver Spring). 2012;20(7):1403–1412. doi: 10.1038/oby.2012.36. - DOI - PMC - PubMed
    1. Beenken A, Mohammadi M. The FGF family: biology, pathophysiology and therapy. Nat Rev Drug Discov. 2009;8(3):235–253. doi: 10.1038/nrd2792. - DOI - PMC - PubMed
    1. Holt JA, et al. Definition of a novel growth factor-dependent signal cascade for the suppression of bile acid biosynthesis. Genes Dev. 2003;17(13):1581–1591. doi: 10.1101/gad.1083503. - DOI - PMC - PubMed
    1. Inagaki T, et al. Fibroblast growth factor 15 functions as an enterohepatic signal to regulate bile acid homeostasis. Cell Metab. 2005;2(4):217–225. doi: 10.1016/j.cmet.2005.09.001. - DOI - PubMed

Publication types

MeSH terms