. 2013 Nov;123(11):4836-48.
doi: 10.1172/JCI67604.

MicroRNA-223 controls susceptibility to tuberculosis by regulating lung neutrophil recruitment

MicroRNA-223 controls susceptibility to tuberculosis by regulating lung neutrophil recruitment

Anca Dorhoi et al. J Clin Invest. 2013 Nov.

Abstract

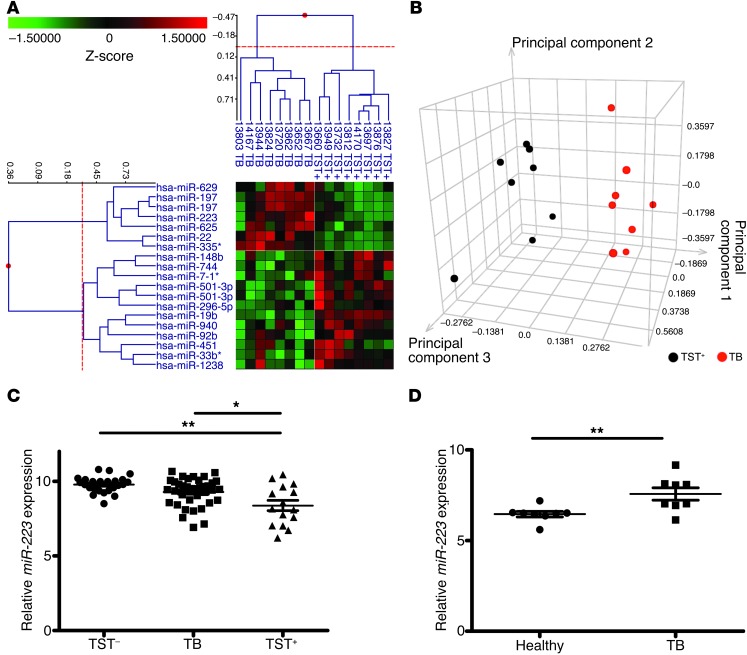
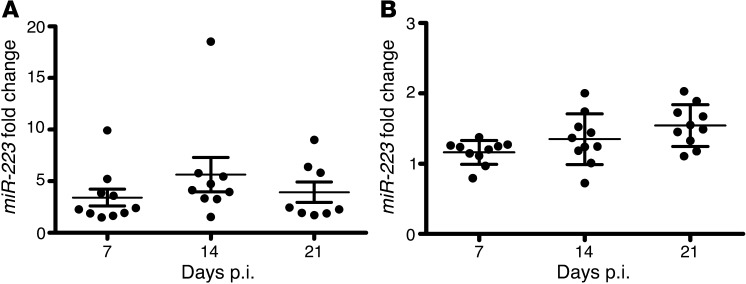
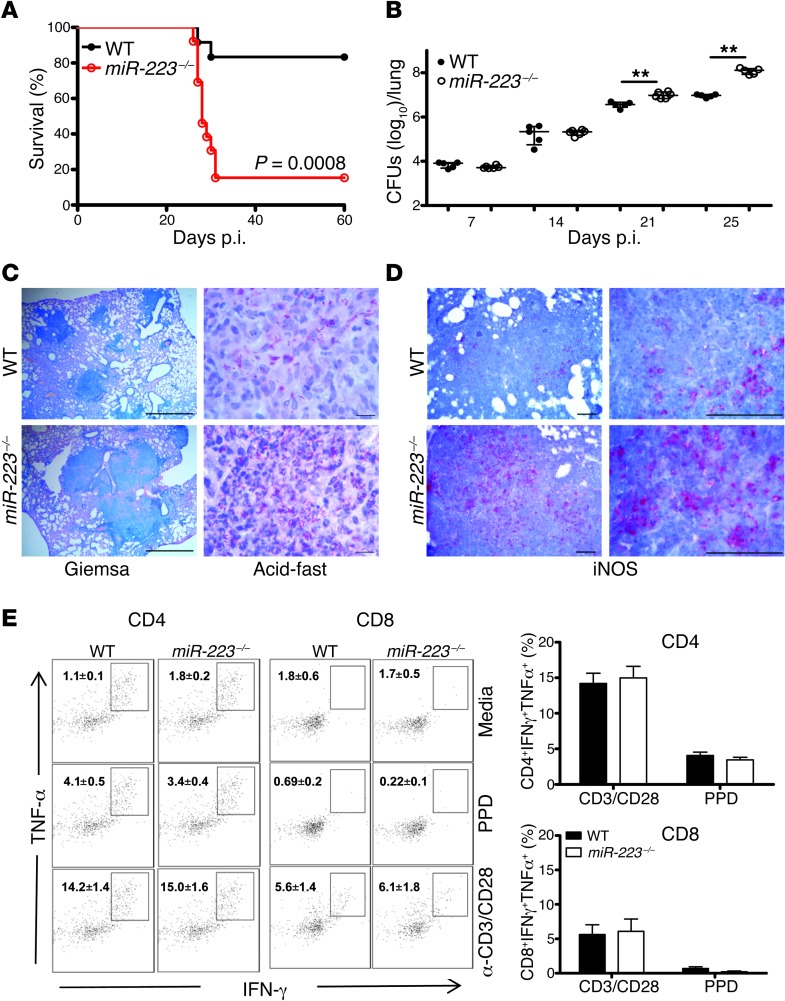
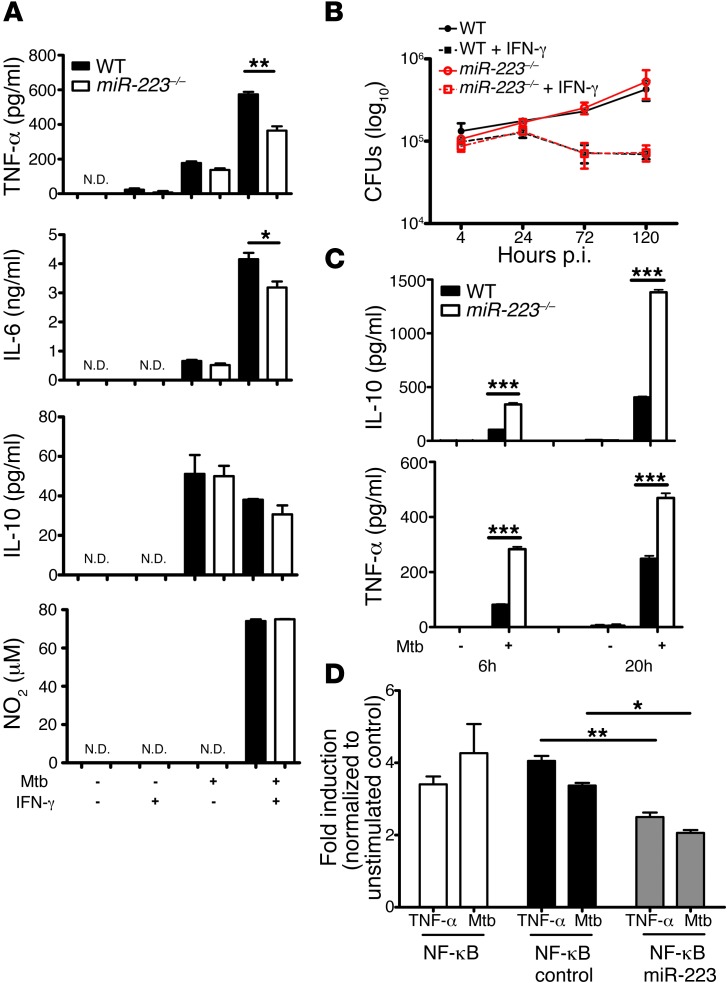
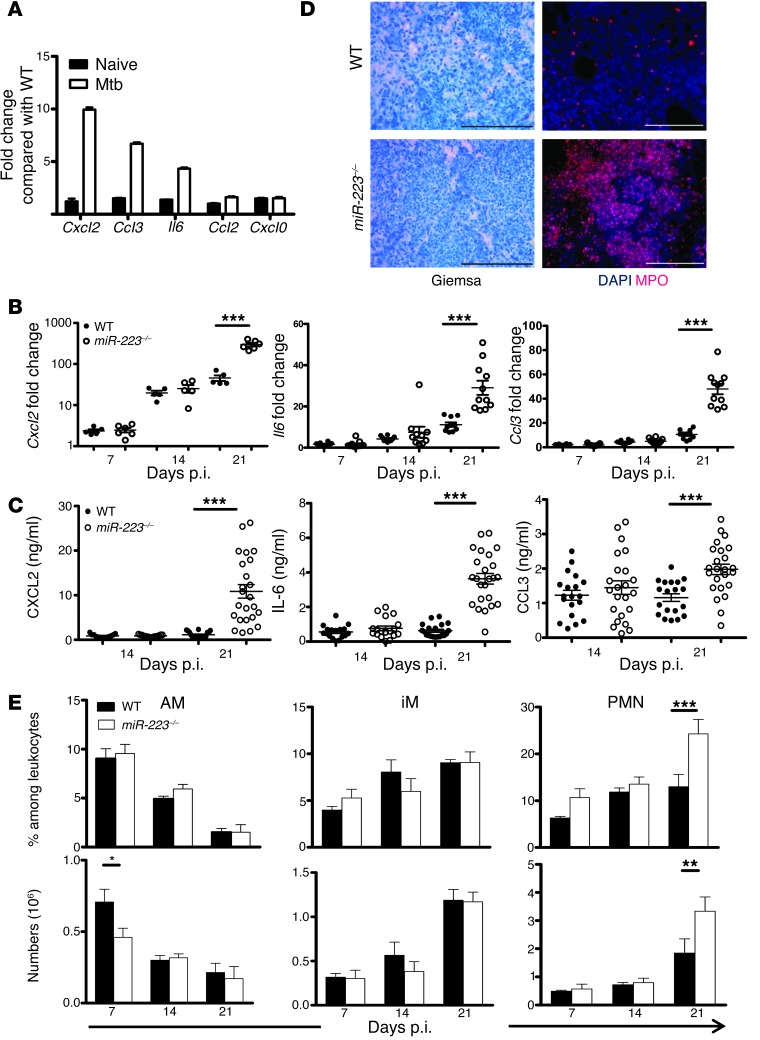
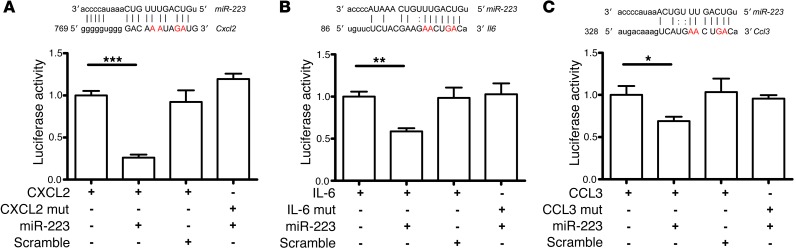
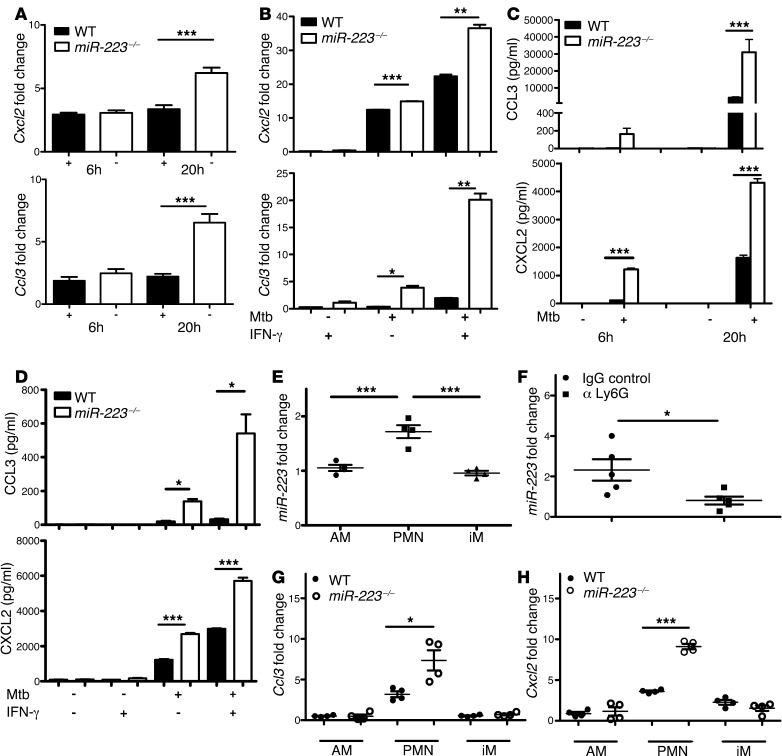
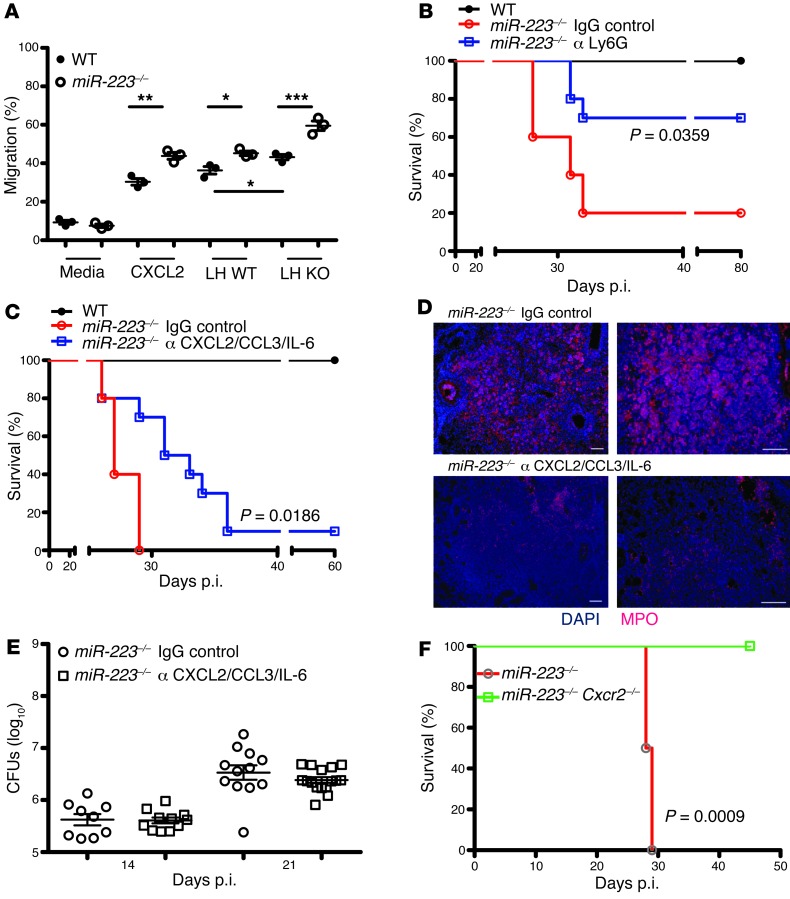
The molecular mechanisms that control innate immune cell trafficking during chronic infection and inflammation, such as in tuberculosis (TB), are incompletely understood. During active TB, myeloid cells infiltrate the lung and sustain local inflammation. While the chemoattractants that orchestrate these processes are increasingly recognized, the posttranscriptional events that dictate their availability are unclear. We identified microRNA-223 (miR-223) as an upregulated small noncoding RNA in blood and lung parenchyma of TB patients and during murine TB. Deletion of miR-223 rendered TB-resistant mice highly susceptible to acute lung infection. The lethality of miR-223(–/–) mice was apparently not due to defects in antimycobacterial T cell responses. Exacerbated TB in miR-223(–/–) animals could be partially reversed by neutralization of CXCL2, CCL3, and IL-6, by mAb depletion of neutrophils, and by genetic deletion of Cxcr2. We found that miR-223 controlled lung recruitment of myeloid cells, and consequently, neutrophil-driven lethal inflammation. We conclude that miR-223 directly targets the chemoattractants CXCL2, CCL3, and IL-6 in myeloid cells. Our study not only reveals an essential role for a single miRNA in TB, it also identifies new targets for, and assigns biological functions to, miR-223. By regulating leukocyte chemotaxis via chemoattractants, miR-223 is critical for the control of TB and potentially other chronic inflammatory diseases.


Figures

Figure 1
Figure 1. Differential miR-223 expression in active human TB.
(A) 2D cluster analysis across miRNA probe (left) and subjects (top) (n = 16). Heatmap shows downregulated (green) and upregulated (red) miRNA. (B) Identification of TB-active (n = 8) and TST+ (n = 8) subjects by PCA based on the miRNAs shown in A. (C) qRT-PCR assay of miR-223 in peripheral blood from TST (n = 24), TB-active (n = 37), and TST+ subjects (n = 15). miR-103 was used as a reference gene. Data are presented as the mean ± SEM; ANOVA with Bonferroni’s post test. (D) qRT-PCR of miR-223 in paraffin-embedded lung tissue from pulmonary TB patients (n = 8) and healthy individuals (n = 8). miR-103 was used as a reference gene. One healthy sample was normalized to 1. Data are presented as the mean ± SEM; unpaired Student’s t test. *P < 0.05; **P < 0.01.
Figure 2
Figure 2. Expression of miR-223 during murine TB.
(A) qRT-PCR of miR-223 in the lungs of Mtb-infected C57BL/6 mice. Data are presented as the mean ± SEM and are pooled from two independent experiments (n = 8–10). (B) qRT-PCR of miR-223 in the blood of Mtb-infected C57BL/6 mice. Data are presented as the mean ± SEM and are pooled from two independent experiments (n = 8–10). Data in A and B were obtained using U6 small nuclear RNA (snRNA) as a reference gene and were normalized to uninfected mice.
Figure 3
Figure 3. Deletion of miR-223 renders resistant mice susceptible to TB.
(A) Survival of miR-223 KO (miR-223–/–) mice and C57BL/6 (WT) littermates after aerosol infection with Mtb (~200 CFUs). Data are representative of two independent experiments; Kaplan–Meier curves and log-rank test (n = 12). (B) Kinetics of bacterial load in lungs of infected mice. Data are presented as the median ± the interquartile range (iQR) and are representative of three independent experiments; Mann-Whitney U test (n = 5–6); **P < 0.01. (C) Large infiltration foci in lung (left panels, Giemsa staining) and numerous bacilli (right panels, acid-fast staining) in the absence of miR-223. Tissues were collected on days 21 and 25 p.i., respectively. Data are representative of two independent experiments. Scale bars: 1,000 μm (left panels) and 10 μm (right panels) (n = 5). (D) Immunohistochemistry for iNOS in lung tissue collected 21 days p.i. Data are representative of two independent experiments (n = 5). Scale bars: 100 μm. (E) Left panels: representative dot plots of CD4+ and CD8+ lymphocytes isolated on day 21 p.i. and stimulated with PPD or CD3/CD28 and then stained for intracellular TNF-α and IFN-γ. Right panels: frequency of cells double-positive for TNF-α and IFN-γ. Data are presented as the mean ± SEM and are pooled from two independent experiments (n = 8–9).
Figure 4
Figure 4. miR-223 regulates the propensity of myeloid cells to release cytokines upon Mtb encounter.
(A) BMDMs were infected with Mtb at an MOI of 5, and cytokine concentrations in cell-free supernatants collected 24 hours p.i. were quantified using ELISA. Data are presented as the mean ± SEM and are representative of five experiments, with three replicates each; Student’s t test. N.D., not detected. (B) BMDMs were infected with Mtb at an MOI of 1, and bacterial growth was determined by CFUs. Data are presented as the mean ± SEM and are representative of five experiments, with three replicates each. (C) Neutrophils (PMNs) were infected with Mtb at an MOI of 10, and cytokine concentrations in cell-free supernatants collected at 6 and 20 hours p.i. were measured using ELISA. Data are presented as the mean ± SEM and are representative of three independent experiments with eight replicates each; Student’s t test. (D) NF-κB induction was measured in murine macrophage RAW 246.7 cells overexpressing miR-223 using an NF-κB reporter after stimulation with TNF-α or infection with Mtb. Data are presented as the mean ± SEM and are representative of three independent experiments with six replicates each; ANOVA with Bonferroni’s post test. *P < 0.05; **P < 0.01; ***P < 0.001.
Figure 5
Figure 5. Lung influx of innate cells during TB is modulated by miR-223.
(A) Relative gene expression of selected genes in lung tissue of miR-223–/– compared with C57BL/6 (WT) mice on days 0 and 21 p.i., as identified by microarray gene chip assay. Data are presented as the mean ± SEM and are combined from two independent experiments (n = 9–11). (B) qRT-PCR of genes differentially expressed in respiratory parenchyma of miR-223–/– animals. Gapd was used as a reference gene, and data were normalized to uninfected mice. Data are presented as the mean ± SEM and are pooled from two independent experiments; Student’s t test (n = 9–11). (C) Concentrations of CXCL2, CCL3, and IL-6 were measured using a multiplex immunoassay in lung homogenates collected 21 days p.i. Data are presented as the mean ± SEM and are pooled from four independent experiments; ANOVA with Bonferroni’s post test (n = 18–24). (D) Giemsa staining and immunohistochemistry for neutrophils (PMNs) and inflammatory monocytes/macrophages (MPO) in lung tissue collected on days 25 and 21 p.i. Data are representative of two independent experiments (n = 5). Scale bars: 100 μm. (E) Frequency and number of alveolar macrophages (AM), inflammatory macrophages (iM), and neutrophils (PMN) isolated from the lungs of miR233–/– and WT infected animals on days 7, 14, and 21 p.i. Data are presented as the mean ± SEM and are pooled from two independent experiments; ANOVA with Bonferroni’s post test (n = 9–10). *P < 0.05; **P < 0.01; ***P < 0.001.
Figure 6
Figure 6. miR-223 directly targets the chemoattractants CXCL2, CCL3, and the cytokine IL-6.
(A) Luciferase activity of HeLa cells transfected with either WT or the seed sequence–mutated (mut) 3′-UTR of Cxcl2 plus scramble and miR-223 mimics. (B) Luciferase activity of HeLa cells transfected with either WT or mutated 3′-UTR of Il6 plus scramble and miR-223 mimics. (C) Luciferase activity of HeLa cells transfected with either WT or mutated 3′-UTR of Ccl3 plus scramble and miR-223 mimics. Renilla luciferase activity is normalized to that of the firefly luciferase and set to 1 in cells with no miRNA mimic or scramble. Mutated nucleotides are highlighted in red. *P < 0.05; **P < 0.01; ***P < 0.001. (AC) Data are the mean ± SEM of three replicates of one representative experiment; Student’s t test.
Figure 7
Figure 7. miR-223 targets Cxcl2 and Ccl3 in a cell-intrinsic manner during TB.
(A and B) Mouse PMNs and BMDMs were infected with Mtb at an MOI of 10 and 5, respectively. Gene expression of Cxcl2 and Ccl3 was measured at 6, 20 (A), and 24 (B) hours p.i. by qRT-PCR. Gapd was used as a reference gene, and data were normalized to uninfected cells. Data are presented as the mean ± SEM and are representative of two experiments with three to five replicates each; Student’s t test. (C and D) Mouse PMNs and BMDMs were infected with Mtb at an MOI of 10 and 5, respectively. Cytokine concentration in cell-free supernatants collected at 6, 20 (C), and 24 (D) hours p.i. was measured using ELISA. Data are presented as the mean ± SEM and are representative of two to five experiments with three to eight replicates; Student’s t test. (E) miR-223 expression in AM, PMN, and iM were FACS sorted from the lungs of C57BL/6 (WT) mice 21 days p.i. Data were obtained using U6 snRNA as a reference gene and were normalized to uninfected mice. Data are from one experiment and are presented as the mean ± SEM; ANOVA with Bonferroni’s post test (n = 4). (F) miR-223 expression was evaluated by qRT-PCR in total lung homogenates obtained on day 25 p.i. from C57BL/6 (WT) mice treated as indicated. Data were obtained using U6 snRNA as a reference gene and were normalized to uninfected mice. Data are presented as the mean ± SEM and are representative of two independent experiments; Student’s t test (n = 5). (G and H) Cxcl2 and Ccl3 expression in AM, PMN, and iM sorted from the lungs of Mtb-infected mice 21 days p.i. Gapd was used as a reference gene, and data were normalized to uninfected mice. Data are from one experiment and are presented as the mean ± SEM; Student’s t test (n = 4). *P < 0.05; **P < 0.01; ***P < 0.001.
Figure 8
Figure 8. Autocrine regulation of PMN recruitment through miR-223–targeted cytokines.
(A) Percentage of neutrophils that migrated toward the indicated stimuli after 2 hours. LH, lung homogenate. Data are presented as the mean ± SEM and are representative of two independent experiments with three replicates each; Student’s t test. (B) miR-223–/– mice were treated with monoclonal antibodies against Ly6G (PMN depletion) or with control IgG or (C) against CXCL2/IL-6/CCL3 during TB, and survival was monitored. Data are representative of two independent experiments; Kaplan-Meier curves and log-rank test (n = 4–10). (D) Immunohistochemistry for neutrophil and inflammatory monocytes/macrophages (MPO) in lung tissue collected 25 days p.i. Data are representative of two experiments (n = 3–4). Scale bars: 100 μm. (E) Bacterial load in the lungs of infected mice treated with monoclonal antibodies against CXCL2/CCL3/IL-6. Data are the median ± iQR and are pooled from three experiments (n = 9–16). (F) Survival of miR-223–/–Cxcr2–/– (n = 7) and miR-223–/– (n = 4) mice after aerosol infection with Mtb; Kaplan-Meier curves and log-rank test. Data are from one experiment. *P < 0.05; **P < 0.01; ***P < 0.001.

References

    1. Philips JA, Ernst JD. Tuberculosis pathogenesis and immunity. Annu Rev Pathol. 2012;7:353–384. doi: 10.1146/annurev-pathol-011811-132458. - DOI - PubMed
    1. Kaufmann SHE. Tuberculosis: back on the immunologists’ agenda. Immunity. 2006;24(4):351–357. doi: 10.1016/j.immuni.2006.04.003. - DOI - PubMed
    1. Lowe DM, Redford PS, Wilkinson RJ, O’Garra A, Martineau AR. Neutrophils in tuberculosis: friend or foe? Trends Immunol. 2012;33(1):14–25. doi: 10.1016/j.it.2011.10.003. - DOI - PubMed
    1. Eum SY, et al. Neutrophils are the predominant infected phagocytic cells in the airways of patients with active pulmonary TB. Chest. 2010;137(1):122–128. doi: 10.1378/chest.09-0903. - DOI - PMC - PubMed
    1. Eruslanov EB, et al. Neutrophil responses to Mycobacterium tuberculosis infection in genetically susceptible and resistant mice. Infect Immun. 2005;73(3):1744–1753. doi: 10.1128/IAI.73.3.1744-1753.2005. - DOI - PMC - PubMed

Publication types

MeSH terms

Associated data