. 2013;5(10):1986-94.
doi: 10.1093/gbe/evt145.

The genomic distribution of sex-biased genes in drosophila serrata: X chromosome demasculinization, feminization, and hyperexpression in both sexes

Affiliations

The genomic distribution of sex-biased genes in drosophila serrata: X chromosome demasculinization, feminization, and hyperexpression in both sexes

Scott L Allen et al. Genome Biol Evol. 2013.

Abstract

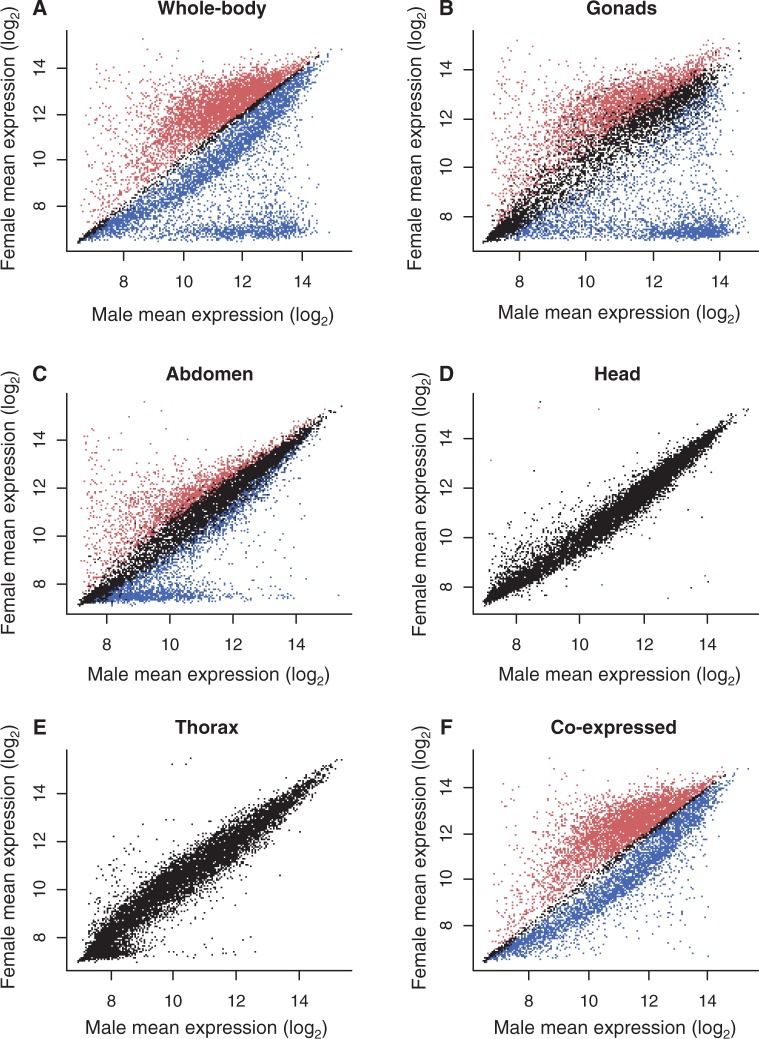
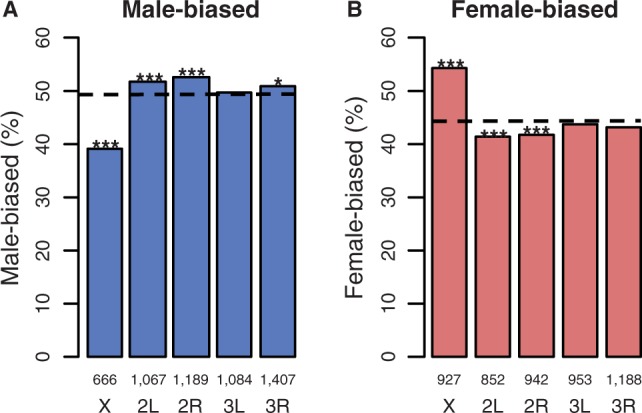
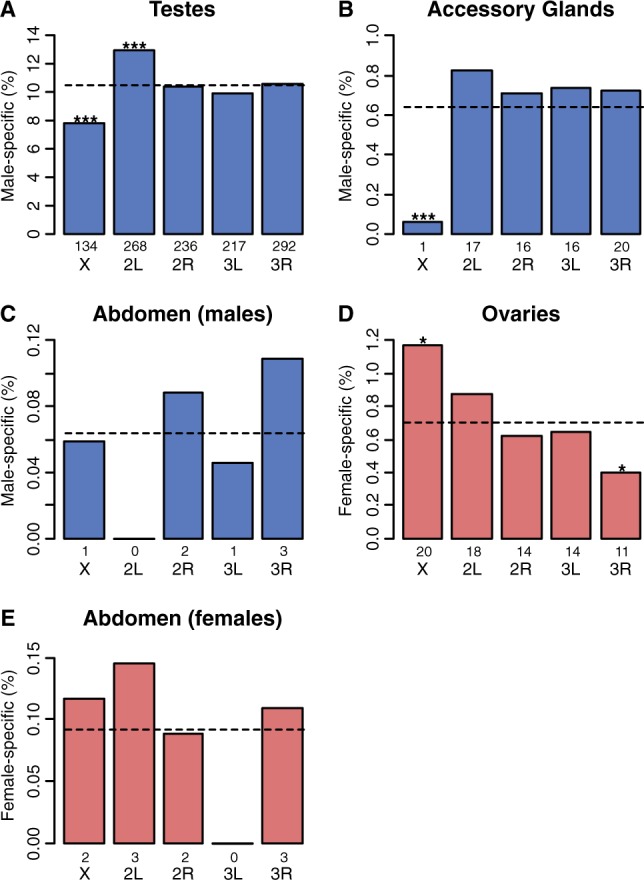
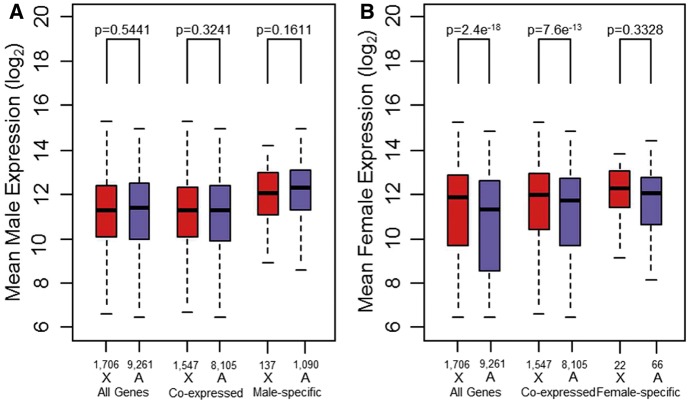
The chromosomal distribution of genes with sex-biased expression is often nonrandom, and in species with XY sex chromosome systems, it is common to observe a deficit of X-linked male-biased genes and an excess of X-linked female-biased genes. One explanation for this pattern is that sex-specific selection has shaped the gene content of the X. Alternatively, the deficit of male-biased and excess of female-biased genes could be an artifact of differences between the sexes in the global expression level of their X chromosome(s), perhaps brought about by a lack of dosage compensation in males and hyperexpression in females. In the montium fruit fly, Drosophila serrata, both these explanations can account for a deficit of male-biased and excess of female-biased X-linked genes. Using genome-wide expression data from multiple male and female tissues (n = 176 hybridizations), we found that testis- and accessory gland-specific genes are underrepresented whereas female ovary-specific genes are overrepresented on the X chromosome, suggesting that X-linkage is disfavored for male function genes but favored for female function genes. However, genes with such sex-specific functions did not fully account for the deficit of male-biased and excess of female-biased X-linked genes. We did, however, observe sex differences in the global expression level of the X chromosome and autosomes. Surprisingly, and in contrast to other species where a lack of dosage compensation in males is responsible, we found that hyperexpression of X-linked genes in both sexes leads to this imbalance in D. serrata. Our results highlight how common genomic distributions of sex-biased genes, even among closely related species, may arise via quite different evolutionary processes.

Keywords: Drosophila; X chromosome; dosage compensation; sex-biased gene expression.


Figures

F<sc>ig</sc>. 1.—
Fig. 1.—
Sex-biased expression of 11,631 genes of D. serrata: (A) whole-body (n = 71 hybridizations per sex), (B) gonads (nfemale = 3, nmale = 4), (C) gonadectomized abdomen (nfemale = 4, nmale = 4), (D) head (nfemale = 4, nmale = 4), (E) thorax (nfemale = 3, nmale = 4), and (F) whole-body excluding sex-specific genes (n = 71 per sex). Red represents female-biased genes, blue are male-biased genes, and black are unbiased genes (Welch’s t-test, FDR < 0.05).
F<sc>ig</sc>. 2.—
Fig. 2.—
The genomic distribution of sex-biased genes in D. serrata: (A) male-biased and (B) female-biased. The dotted line is the expected percentage of sex-biased genes per chromosome from 1,000 random permutations of the data; numbers above chromosome labels indicate the number of genes in each bar, and asterisk indicates probablilty that observed value does not differ from expected: ***P < 0.001, **P < 0.01, *P < 0.05.
F<sc>ig</sc>. 3.—
Fig. 3.—
The X chromosome of D. serrata is lacking in male-biased and enriched for female-biased genes. Male-specific tissues are shown in blue and female-specific in red. The number of sex-specific genes per tissue is shown in table 1. The dotted line is the random expectation for the percentage of biased genes per chromosome estimated from 1,000 permutations; numbers above chromosome labels indicate the number of genes in each bar, and asterisk indicates probablilty that observed value does not differ from expected: ***P < 0.001, **P < 0.01, *P < 0.05.
F<sc>ig</sc>. 4.—
Fig. 4.—
Dosage compensation via hyperexpression in both sexes. (A) Boxplots showing mean expression of X-linked genes (red) and autosomal genes (blue) for males. Plots are shown for all genes on the microarray (All Genes) and subsets containing either genes expressed in both sexes (Co-expressed) or genes expressed in one sex only (sex-specific). P values are from Mann–Whitney U tests comparing expression on the X chromosome versus the autosomes (see Materials and Methods). (B) As in (A) but for females. Numbers above chromosome labels indicate the number of genes.

References

    1. Bachtrog D, Toda NR, Lockton S. Dosage compensation and demasculinization of X chromosomes in Drosophila. Curr Biol. 2010;20:1476–1481. - PMC - PubMed
    1. Benjamini Y, Hochberg Y. Controlling the false discovery rate—a practical and powerful approach to multiple testing. J R Stat Soc B. 1995;57:289–300.
    1. Betran E, Thornton K, Long M. Retroposed new genes out of the X in Drosophila. Genome Res. 2002;12:1854–1859. - PMC - PubMed
    1. Bhavsar RB, Makley LN, Tsonis PA. The other lives of ribosomal proteins. Hum Genomics. 2010;4:327–344. - PMC - PubMed
    1. Bhutkar A, et al. Chromosomal rearrangement inferred from comparisons of 12 Drosophila genomes. Genetics. 2008;179:1657–1680. - PMC - PubMed

Publication types