. 2013 Oct 1:9:692.
doi: 10.1038/msb.2013.50.

Human disease locus discovery and mapping to molecular pathways through phylogenetic profiling

Affiliations

Human disease locus discovery and mapping to molecular pathways through phylogenetic profiling

Yuval Tabach et al. Mol Syst Biol. .

Abstract

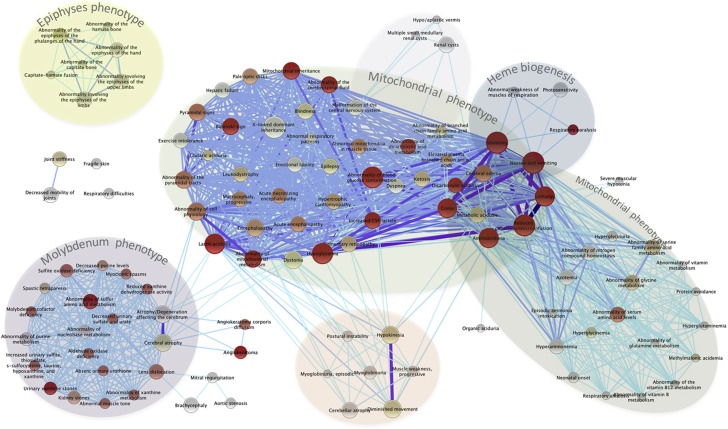
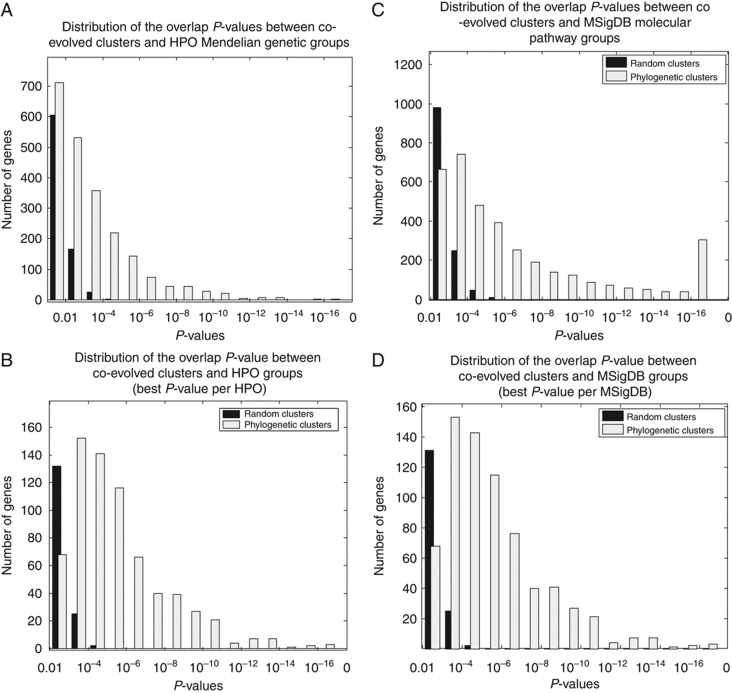
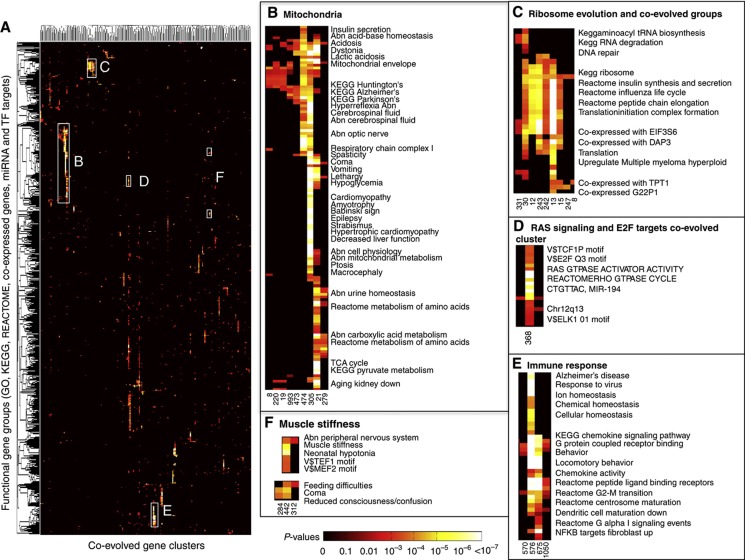
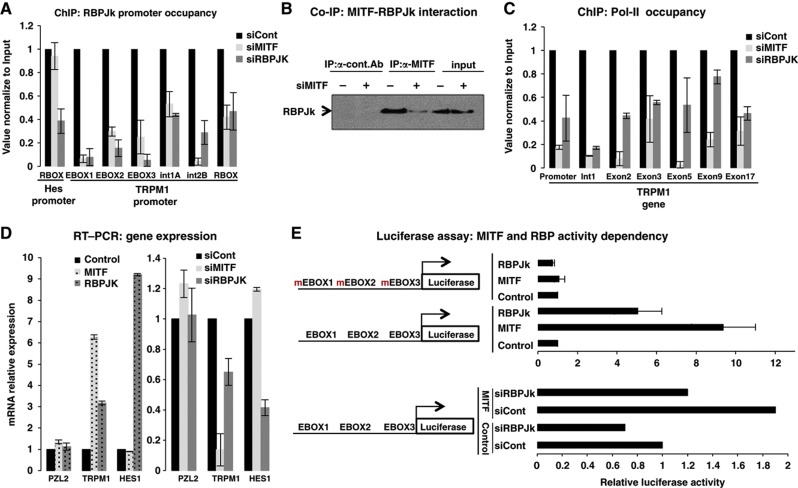
Genes with common profiles of the presence and absence in disparate genomes tend to function in the same pathway. By mapping all human genes into about 1000 clusters of genes with similar patterns of conservation across eukaryotic phylogeny, we determined that sets of genes associated with particular diseases have similar phylogenetic profiles. By focusing on those human phylogenetic gene clusters that significantly overlap some of the thousands of human gene sets defined by their coexpression or annotation to pathways or other molecular attributes, we reveal the evolutionary map that connects molecular pathways and human diseases. The other genes in the phylogenetic clusters enriched for particular known disease genes or molecular pathways identify candidate genes for roles in those same disorders and pathways. Focusing on proteins coevolved with the microphthalmia-associated transcription factor (MITF), we identified the Notch pathway suppressor of hairless (RBP-Jk/SuH) transcription factor, and showed that RBP-Jk functions as an MITF cofactor.


Figures

Figure 1
Figure 1
Phylogenetic profiles. (A) Phylogenetic profiles of 19 017 human genes across 86 eukaryotic genomes. The matrix was normalized by the evolutionary distances between organisms and the protein length and clustered using average linkage. The entry values are between 0 and 1 where 1 (dark blue) represents 100% identity and 0 (white) corresponds to no detectable homolog. (B) Phylogenetic profile of TCA cycle genes. The specific core profile (green rectangles) is defined mainly by genes lost across three protists: C. parvum, G. intestinalis, and E. histolytica. The detailed analysis of the phylogenetic profile predicts more subtle functions as well. For example, IDH1 and IDH3 function at the same step in the cycle (Supplementary Figure S1), but the gene with the core profile, IDH1, functions more centrally. A less conserved gene, IDH3, has a tissue-specific function. (C) Phylogenetic profile of genes (red box) that include the descriptor respiratory paralysis (HP:0002203). Mutations in these genes cause defects in heme biogenesis and porphyria disorders. Mutations in five other genes with a similar phylogenetic profile (pink box) cause porphyria or coproporphyria. Ten more genes (gray box) with similar phylogenetic profiles are predicted to mediate heme biogenesis and to cause porphyria-like symptoms when defective. (D) Phylogenetic profile of genes associated with urinary xanthine stone and sulfite oxidase deficiency HPO classifications (red and pink boxes) in addition to 18 genes with similar phylogenetic profiles (gray box). Of these 18 genes, MOSC2 and MOSC1 were recently identified as a new family of molybdenum enzymes. AOX1 is associated with xanthine urinary stones although a function was not assigned by the HPO database. Mutations in the HGD gene cause alkaptonuria disease. (E) Conservation pattern of the human genes MITF and RBP-Jk in 86 organisms. The scores are between 0 and 1, with 1 representing 100% identity and 0 corresponding to no detectable homolog.
Figure 2
Figure 2
Coevolution scores (Co10) and q-values for MSigDB gene sets. (AE) Scatter plots of the Co10 scores (y axis) and the number of genes (x axis) in each classification of the MSigDB sets (blue x’s) were calculated using normalized phylogenetic profiling (NPP) with 86, 64, 43, and 22 organisms. Binary phylogenetic profiles were calculated with 86 organisms. The blue x’s represent the Co10 scores of human gene sets from MSigDB, which includes KEGG-annotated sets such as MAP kinase signaling-annotated genes or ribosomal-annotated genes. The dots represent the distribution of Co10 scores associated with 100 000 randomly generated gene sets derived from randomized MsigDB gene lists. The color scale of the dots represents the number of random groups found at that position (red—one random group to purple when >10 random groups with the same size have the same Co10 score). The white lines represent the average of the random data (bold line) and 1–4 standard divisions from the average. (F) The q-value distribution of the MSigDB sets obtained using NPP with 86, 64, 43, and 22 organisms and BPP with 86 organisms.
Figure 3
Figure 3
Genes associated with particular diseases have significantly higher coevolution scores. The dots denote the random distribution of Co10 scores that emerge from a randomized set of 100 000 HPO gene sets. The color scale of the dots represents the number of random groups found at that position (red—one random group to purple when >10 random groups with the same size have the same Co10 score). The white lines represent the average of the random data (bold line) and 1–4 standard divisions from the average. Notice that there are a significant number of bona fide HPO groups with numbers of genes in those groups ranging from a few to hundreds that are far from the random expectation cloud of dots.
Figure 4
Figure 4
Many of the diseases associated with high coevolution scores share genetic components. Significant HPOs (q-value<0.05) with <100 genes are present as nodes. The color code scale represents the Co10 significance score from gray (q-value=0.05) to cherry (P-value <10−6). The size of the HPO reflects the fraction of coevolved genes out of the all the genes in the HPO (i.e., the genes that contribute to the Co10 score). Two HPOs are connected by edge if they share two or more coevolved genes (see Supplementary Table S4), such that the number of the shared genes reflected in the edge width and color, with more genes are represented by a thicker and darker line.
Figure 5
Figure 5
P-value distribution of the overlap between coevolved clusters and random or functional gene groups. (A) Distribution of the hypergeometric P-values of the significant overlap between every pair of coevolved cluster with HPO group (white bars), or coevolved cluster with randomly permutated HPO in the same size (black bars). (B) The P-value distribution using only the best P-value per HPO group (white bars) or randomly permutated HPO groups (black bars). (C) Distribution of the hypergeometric P-values using 6600 MSigDB functional groups (white bars) or randomly permuted MSigDB groups (black bars). (D) The P-value distribution using the best P-value per MSigDB.
Figure 6
Figure 6
(A) Heat map of the overlap between coevolved clusters and functional and disease gene sets (rows). Each dot in row i and column j represented the P-value of the overlap between functional/disease group (in row i) and coevolved cluster (in column j). The color code represents the P-values indicating the significance of the overlap. The white boxes delineate the indicated insets representing coevolved clusters that are associated with either (B) mitochondria, (C) ribosome (D) RAS signaling, and E2F (E) immune response, or (F) muscle stiffness. The data can be found in Supplementary Table S5.
Figure 7
Figure 7
RBP-Jk is an MITF gene coregulator. (A) Binding of RBP-Jk to an endogenous TRPM1 promoter in an MITF-dependent manner. ChIP analyses were performed using log-phase primary human melanomas on TRPM1 promoter upon depletion of MITF (by treatment with siMITF) or RBP-Jk (by treatment with siRBP-Jk). Protein:chromatin-crosslinked complexes were immunoprecipitated with RBP-Jk antibody. RBP-Jk occupancy was calculated relative to cells transfected with control siRNA (siCont), normalized to input, and represent mean±s.d. of three independent experiments. Controls are shown in Supplementary Figure S3. (B) MITF and RBP-Jk directly interact. CoIP was performed using MITF and RBP-Jk antibodies. Reactions were treated with DNase to exclude the possibility that the MITF:RBPJk interaction is DNA dependent. (C) Pol-II occupancy on the TRPM1 locus was performed upon MITF or RBP-Jk depletion with indicated siRNA. (D) Endogenous TRPM1 levels were affected by RBP-Jk perturbation. Primary human melanomas were transfected with siMITF, siRBP-Jk, or scrambled control siRNA (siCont). TRPM1 mRNA levels were measured by qRT–PCR. HES1 mRNA levels were measured as a control for a gene known to be controlled by and an RBP-Jk target gene and PZL2 was used as an irrelevant control gene (upper panel). TRPM1 levels were also increased upon RBP-Jk overexpression (lower panel). Melanoma cells were transfected with MITF or RBP-Jk expression vectors or empty vector. Results are normalized to actin and are relative to siCont or empty vector, respectively, and represent mean±s.d. of five replicates. (E) MITF and RBP-Jk activity is mutually dependent. Upper panel shows that RBP-Jk activity is MITF dependent. Human primary melanoma cells were transiently transfected with empty vector, MITF, or RBP-Jk (0.5 μg each), TRPM1 promoter reporters (0.3 μg), and Renilla luciferase construct (0.1 μg). At 48 h after transfection, cell lysates firefly and Renilla luciferase activities were measured. Lower panel shows that when RBP-Jk is absent MITF-dependent transcriptional activity is compromised. Human primary melanoma cells were transiently transfected with siControl or siRBP-Jk. The next day, cells were transfected as indicated. Data are presented as mean values and s.d. for at least three independent experiments compared with the level of luciferase activity obtained in the presence of empty vector.
Figure 8
Figure 8
Ccdc105 characterization. (A) RT–PCR analysis of Ccdc105 mRNA expression in mouse tissues. Actin was used as a positive control for mRNA amplification. (B) Western blot of CCDC105 in protein extracts from testes. Purified antibodies against peptides 1 and 3 recognized a band of around 57 kilodaltons (kD), the predicted size for this protein, in total protein extracts from testes (Total). CCDC105 protein is mostly detected in nuclear extracts (Nuc), whereas in cytoplasmic extracts (Cyto) little or no signal was detected. (CF) Immunolabeling of CCDC105 on spread cells from testes. Anti-SYCP3 antibody labels the synaptonemal complex throughout the meiotic prophase I, and its labeling pattern was used to identify cells in meiosis. Anti-CREST antibody labels centromeres and anti-CCDC105 antibody (anti-peptide 1) is localized in a region where SYCP3 and CREST colocalize at diplotene stage (meiotic cells) and in clustered centromeres in round spermatids (post-meiotic cells) (arrowheads in D and E). z, zygotene cells; p, pachytene cells; d, diplotene cells; rs, round spermatids. Bars represent 10 micrometers (μm).

Similar articles

Cited by

References

    1. Adler P, Kolde R, Kull M, Tkachenko A, Peterson H, Reimand J, Vilo J (2009) Mining for coexpression across hundreds of datasets using novel rank aggregation and visualization methods. Genome Biol 10: R139. - PMC - PubMed
    1. Agrawal P, Yu K, Salomon AR, Sedivy JM (2010) Proteomic profiling of Myc-associated proteins. Cell Cycle 9: 4908–4921 - PMC - PubMed
    1. Alberts B, Johnson A, Lewis J, Raff M, Roberts K, Walter P (2002) Molecular Biology of the Cell, 4th edn. Garland Science, New York, USA
    1. Ashburner M, Ball CA, Blake JA, Botstein D, Butler H, Cherry JM, Davis AP, Dolinski K, Dwight SS, Eppig JT, Harris MA, Hill DP, Issel-Tarver L, Kasarskis A, Lewis S, Matese JC, Richardson JE, Ringwald M, Rubin GM, Sherlock G (2000) Gene ontology: tool for the unification of biology. The Gene Ontology Consortium. Nat Genet 25: 25–29 - PMC - PubMed
    1. Aubin-Houzelstein G, Djian-Zaouche J, Bernex F, Gadin S, Delmas V, Larue L, Panthier JJ (2008) Melanoblasts' proper location and timed differentiation depend on Notch/RBP-J signaling in postnatal hair follicles. J Invest Dermatol 128: 2686–2695 - PubMed

Publication types

MeSH terms

Substances

LinkOut - more resources