. 2013 Oct 2:3:2650.
doi: 10.1038/srep02650.

Comprehensive identification of mutational cancer driver genes across 12 tumor types

Affiliations

Comprehensive identification of mutational cancer driver genes across 12 tumor types

David Tamborero et al. Sci Rep. .

Abstract

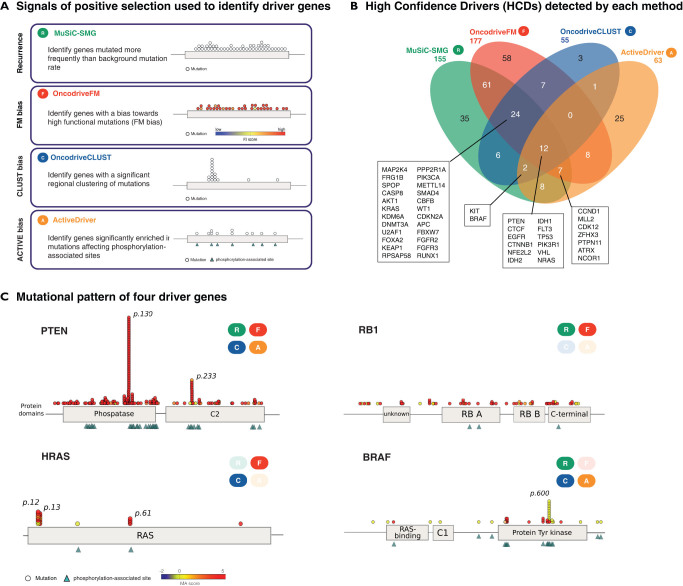
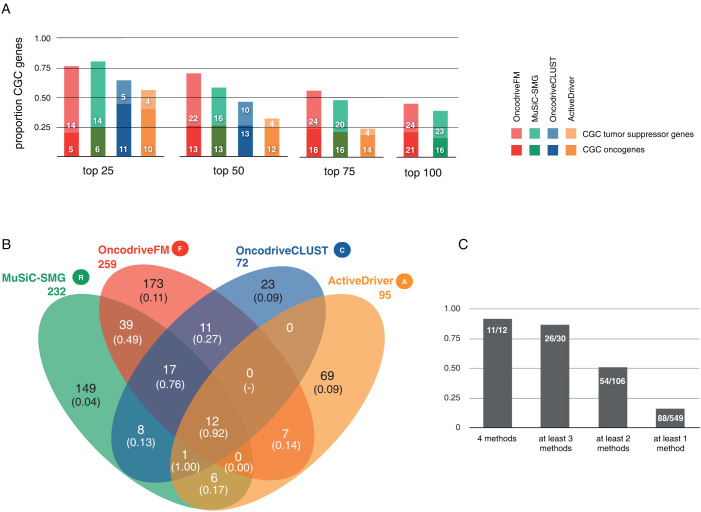
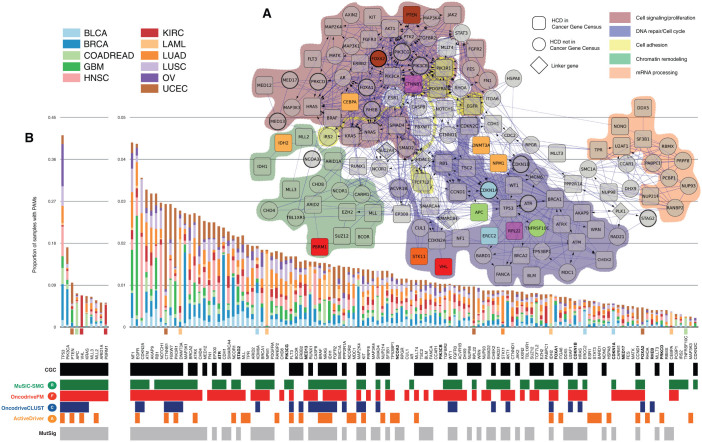
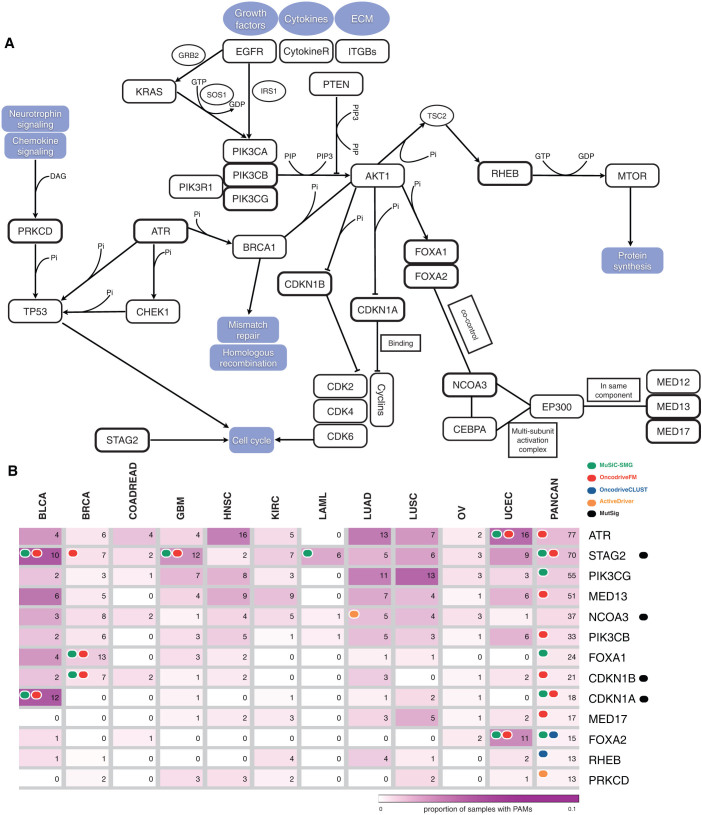
With the ability to fully sequence tumor genomes/exomes, the quest for cancer driver genes can now be undertaken in an unbiased manner. However, obtaining a complete catalog of cancer genes is difficult due to the heterogeneous molecular nature of the disease and the limitations of available computational methods. Here we show that the combination of complementary methods allows identifying a comprehensive and reliable list of cancer driver genes. We provide a list of 291 high-confidence cancer driver genes acting on 3,205 tumors from 12 different cancer types. Among those genes, some have not been previously identified as cancer drivers and 16 have clear preference to sustain mutations in one specific tumor type. The novel driver candidates complement our current picture of the emergence of these diseases. In summary, the catalog of driver genes and the methodology presented here open new avenues to better understand the mechanisms of tumorigenesis.


Figures

Figure 1
Figure 1
(A) Illustration of the four signals of positive selection used to identify driver genes and the methods that implement them. (B) Venn diagram showing the contribution of each method in number of genes that it detects to the list of HCDs. The names of the genes detected by 3 or more methods are shown. (C) Mutational patterns of 4 HCDs. Circles represent protein affecting mutation across pan-cancer samples, and are colored according to their functional impact calculated by the Mutation Assessor method. Triangles indicate active residues of the protein in which mutation occurs. Protein domains retrieved from Pfam are depicted. Label boxes indicate which of the methods identifies the gene as significant.
Figure 2
Figure 2. Validation of methods' output lists of driver candidates and the approach taken to combine them.
(A) Proportion of genes included in the Cancer Gene Census (CGC) depending on the number of top-ranking genes from the list retrieved by each method from the pan-cancer analysis. Note that OncodriveCLUST retrieves only 72 genes, therefore it does not appear in the last two histograms, and ActiverDriver retrieves 95 genes, and thus it doesn't appear in the last histogram. (B) Venn diagram showing the overlap between the genes selected by each method in the pan-cancer analysis. The numbers in parenthesis represent the CGC genes rate in each group. Note that the CGC rates of groups of genes exhibiting more than one signal of positive selection range from 13% (OncodriveCLUST-MuSiC) to 92% (genes with the four signals). On the other hand, these rates are rather low in genes that posses only one signal, ranging between 4% (MuSiC) and 11% (OncodriveFM). Based on these results we decided to establish the quasi-majority vote described in Methods to select the genes in the core of the HCD list. In other words, genes with at least two signals of positive selection either in the pan-cancer analysis and/or any per-project analysis were nominated as high-confidence drivers. (C) Bar graph detailing the proportion of CGC depending on the number of signals of positive selection identified in the genes.
Figure 3
Figure 3
(A) Network representation of HCDs. Trimmed version of the functional interaction network integrated by 124 HCDs that either map to the five broad biological modules enriched among HCDs or connect them. Genes annotated in the CGC are represented as round squares, HCDs not in CGC are represented as circles and non-HCDs used as linkers between HCDs as diamonds. Circles with thicker border are ‘novel’ candidate drivers discussed in supplementary Table 4 and shown in Figure 3. Genes with a clear preference for bearing PAMs in one tumor type (Fisher's odds ratio > 25) are colored following the project code shown in the figure legend. Colored shadows encircle genes within five enriched biological modules. (B) Frequency of PAMs observed HCDs in panel A across samples of each cancer type, following the tumor type color code. The annotations below indicate methods that identify each gene signals of positive selection. Genes with clear preference for bearing PAMs in one tumor type are indicated with a colored square below the histogram, using the tumor type color code. ‘Novel’ driver candidates are shown in bold font.
Figure 4
Figure 4
(A) Diagram showing 13 selected candidate cancer genes within their functional interaction context. (B) Heat-map depicting the frequency and number of samples with PAMs of the 13 selected ‘novel’ cancer genes in each tumor type and in the complete pan-cancer dataset. Colored circles indicate methods identifying each gene either in the per-project analyses or in the pan-cancer analysis. Note that six of the genes in the Figure show two signals of positive selection and are therefore not included within the HCDs due to their connections with other drivers.
Figure 5
Figure 5
(A) Histogram of the proportion of samples in the pancancer dataset with PAMs in HCDs. (B) Proportion of samples in each cancer type with PAMs in HCDs.

References

    1. Reddy E. P., Reynolds R. K., Santos E. & Barbacid M. A point mutation is responsible for the acquisition of transforming properties by the T24 human bladder carcinoma oncogene. Nature 300, 149–152 (1982). - PubMed
    1. Tabin C. J. et al. Mechanism of activation of a human oncogene. Nature 300, 143–149 (1982). - PubMed
    1. Futreal P. A. et al. A census of human cancer genes. Nature Reviews. Cancer 4, 177–183 (2004). - PMC - PubMed
    1. Consortium T. C. G. A. et al. Comprehensive genomic characterization defines human glioblastoma genes and core pathways. Nature 455, 1061–1068 (2008). - PMC - PubMed
    1. ICGC. International network of cancer genome projects. Nature 464, 993–998 (2010). - PMC - PubMed

Publication types