

doi: 10.1038/srep02652.
Exploring TCGA Pan-Cancer data at the UCSC Cancer Genomics Browser
Affiliations
- PMID: 24084870
- PMCID: PMC3788369
- DOI: 10.1038/srep02652
Item in Clipboard
Exploring TCGA Pan-Cancer data at the UCSC Cancer Genomics Browser
Sci Rep.
.
Abstract
The UCSC Cancer Genomics Browser (https://genome-cancer.ucsc.edu) offers interactive visualization and exploration of TCGA genomic, phenotypic, and clinical data, as produced by the Cancer Genome Atlas Research Network. Researchers can explore the impact of genomic alterations on phenotypes by visualizing gene and protein expression, copy number, DNA methylation, somatic mutation and pathway inference data alongside clinical features, Pan-Cancer subtype classifications and genomic biomarkers. Integrated Kaplan-Meier survival analysis helps investigators to assess survival stratification by any of the information.
Figures
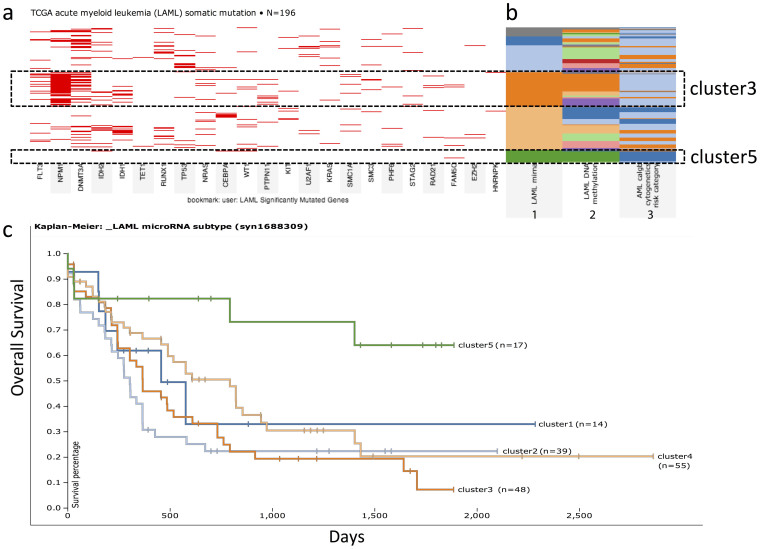
(a) Somatic mutations for the most-significantly mutated genes in TCGA AML tumor samples. Samples are arranged in rows and genes in columns. Red indicates that the tumor sample harbors non-synonymous coding mutations in the corresponding gene while white indicated that such mutations were not detected. (b) Column 1 represents the miRNA expression clusters, Column 2 represents the DNA methylation clusters (Peter Laird, Personal communication), and Column 3 represents cytogenetic risk category for the AML cohort. For each column, each cluster or category was assigned a distinct color from the D3 color map (https://github.com/mbostock/d3/wiki/Ordinal-Scales ), with five clusters for miRNA expression (cluster 1–5) and nine for DNA methylation (cluster 1–9), and three for cytogenetic risk category (favorable, intermediate, poor). A strong concordance is observed between miRNA cluster 3 (orange), DNA methylation cluster 3 (also orange) and intermediate cytogenetic risk (light blue); and between miRNA cluster 5 (green), DNA methylation cluster 5 (also green) and favorable cytogenetic risk (dark blue). (c) The integrated Kaplan-Meier plot confirms that miRNA cluster 5 (green line) has a more favorable overall survival profile. The colors of the lines correspond to the colors of the miRNA clusters. See https://genome-cancer.ucsc.edu/proj/site/hgHeatmap/#?bookmark=sr1 .
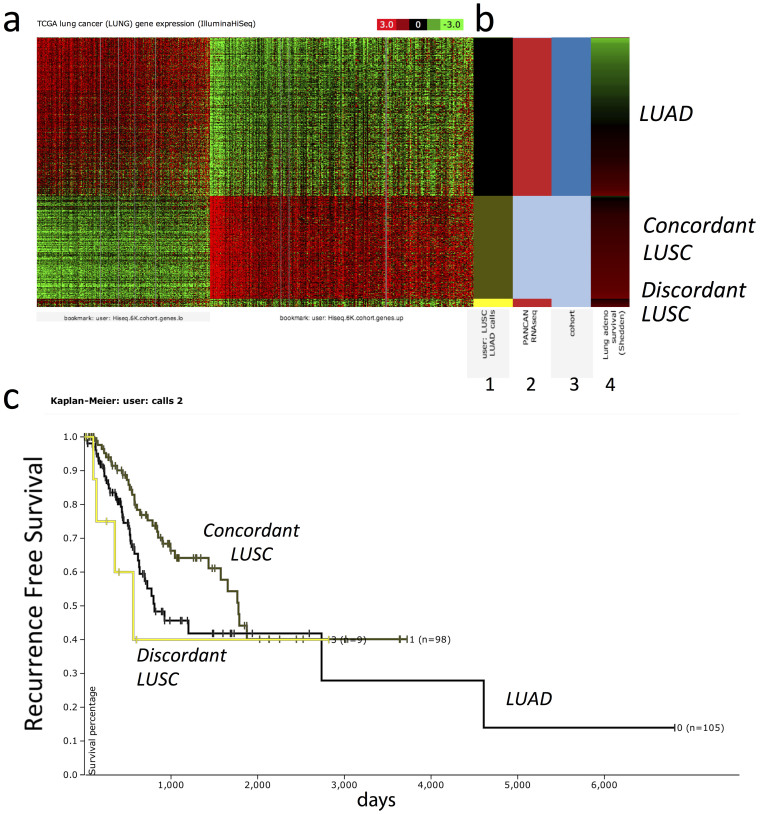
(a) The heatmap shows gene expression for TCGA LUAD and LUSC samples in a combined lung cohort, over a set of genes differentially expressed (> 3 fold) between the two cohorts. (b) Column 1 is user custom annotation that partitions the samples into three groups: LUAD, concordant LUSC (where the cohort and the RNA subtype are consistent), and discordant LUSC (where the cohort and RNA subtype are inconsistent). Column 2 is tumor's Pan-Cancer RNA subtype designation. Red: LUAD-like. Light blue: squamous-like. Column 3 is tumor type by pathology, which is equivalent to the TCGA cohort. Dark blue: LUAD. Light blue: LUSC. Column 4 is the Shedden gene expression signature where higher signature score (red) predicts poor overall survival in LUAD. The discordant LUSC samples have a gene expression pattern weakly resembles LUAD. (c) The Kaplan-Meier plot indicates that the discordant LUSC samples (bottom, yellow) have a worse recurrence free survival profile than the concordant LUSC samples (top, brown). See https://genome-cancer.ucsc.edu/proj/site/hgHeatmap/#?bookmark=sr2 .
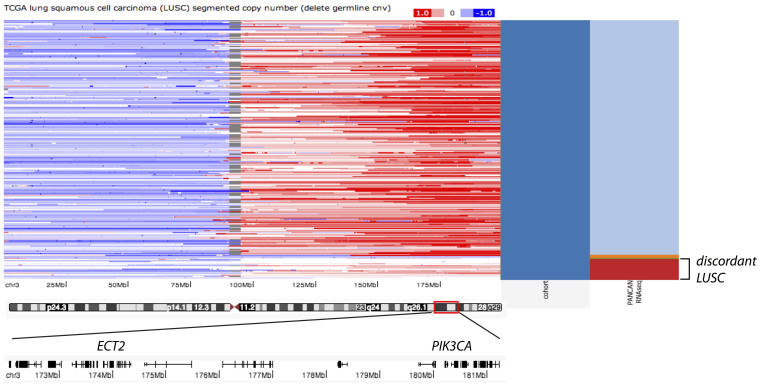
LUSC: lung squamous cell carcinoma. LUAD: lung adenocarcinoma. See https://genome-cancer.ucsc.edu/proj/site/hgHeatmap/#?bookmark=sr3 .
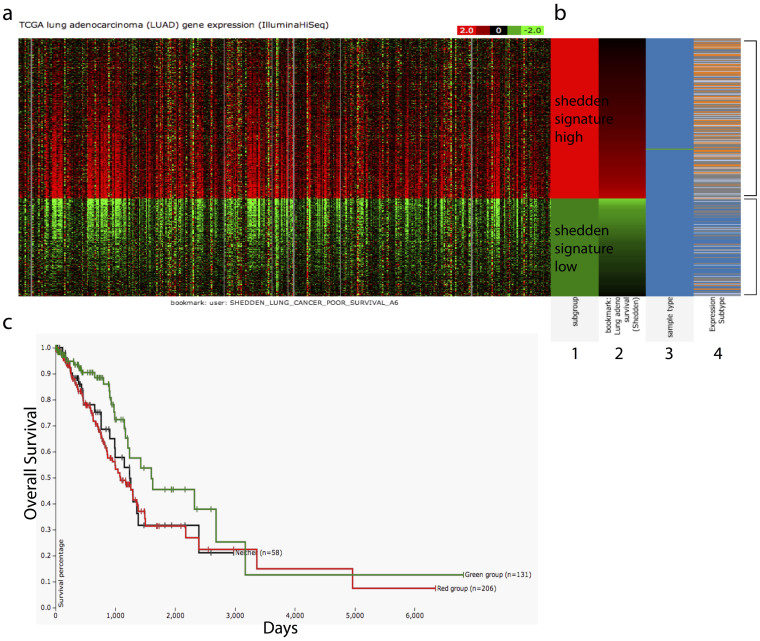
(a) UCSC Cancer Genomics Browser heatmap view of the gene expression data over the set of genes that used by Shedden et. al. to predict overall survival in LUAD. When these genes are up-regulated, their expression profile predicts poor overall survival in LUAD. (b) TCGA LUAD sample annotation shown in the UCSC Cancer Genomics Browser clinical heatmap as four columns. Column 1 is the user-defined two subgroups of samples. Red group: samples with high Shedden signature value. Green group: samples with low signature value. Column 2 is the Shedden signature score built using the browser's genomic signature functionality. Red to green color represents higher to lower signature scores computed dynamically. Column 3 is the tumor sample type. Blue: primary tumor. Green: recurrent tumor. Column 4 is LUAD gene expression subtype. Dark blue: Bronchioid. Light Blue: Magnoid. Orange: Squamoid. (c) Shedden signature high score subgroup (red line) has a worse overall survival compared to the low score subgroup (green line). See https://genome-cancer.ucsc.edu/proj/site/hgHeatmap/#?bookmark=sr4 .
References
Publication types
MeSH terms
Grants and funding
LinkOut - more resources
Full Text Sources
Other Literature Sources
