. 2014 Jan;13(1):30-48.
doi: 10.1074/mcp.M113.028621. Epub 2013 Oct 1.

Integrated glycoproteomics demonstrates fucosylated serum paraoxonase 1 alterations in small cell lung cancer

Affiliations

Integrated glycoproteomics demonstrates fucosylated serum paraoxonase 1 alterations in small cell lung cancer

Jung-Mo Ahn et al. Mol Cell Proteomics. 2014 Jan.

Abstract

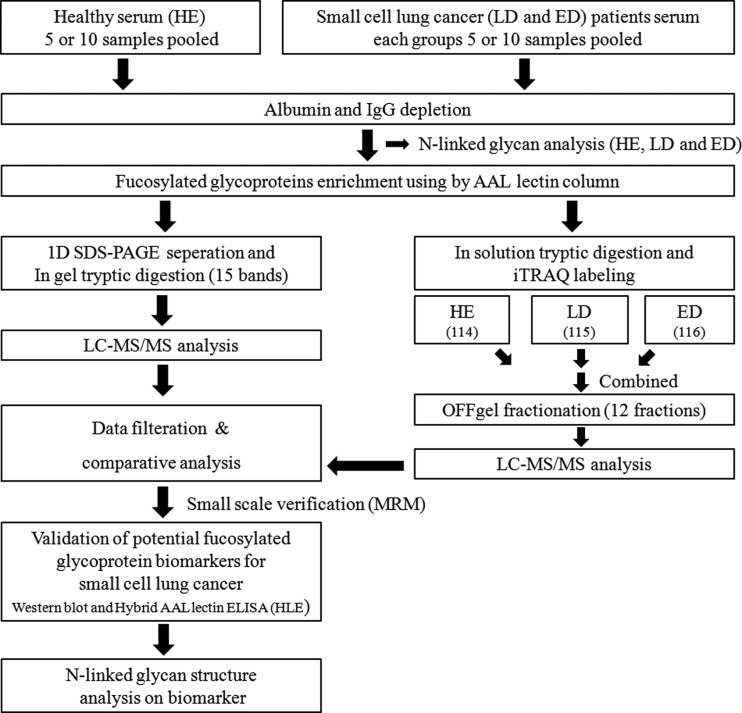
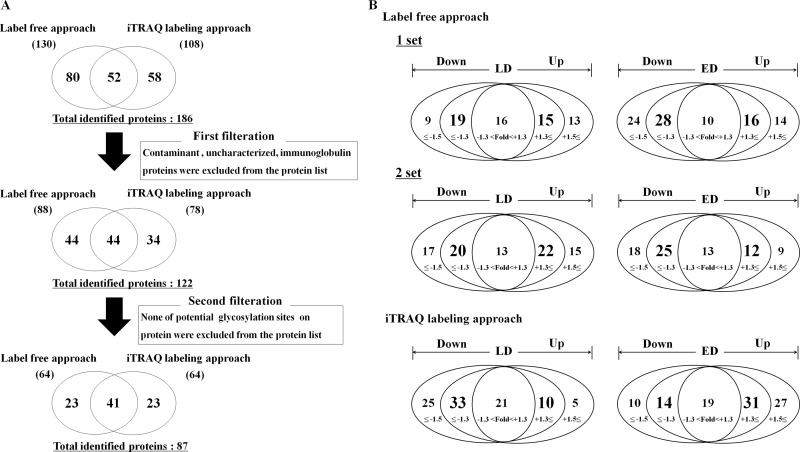
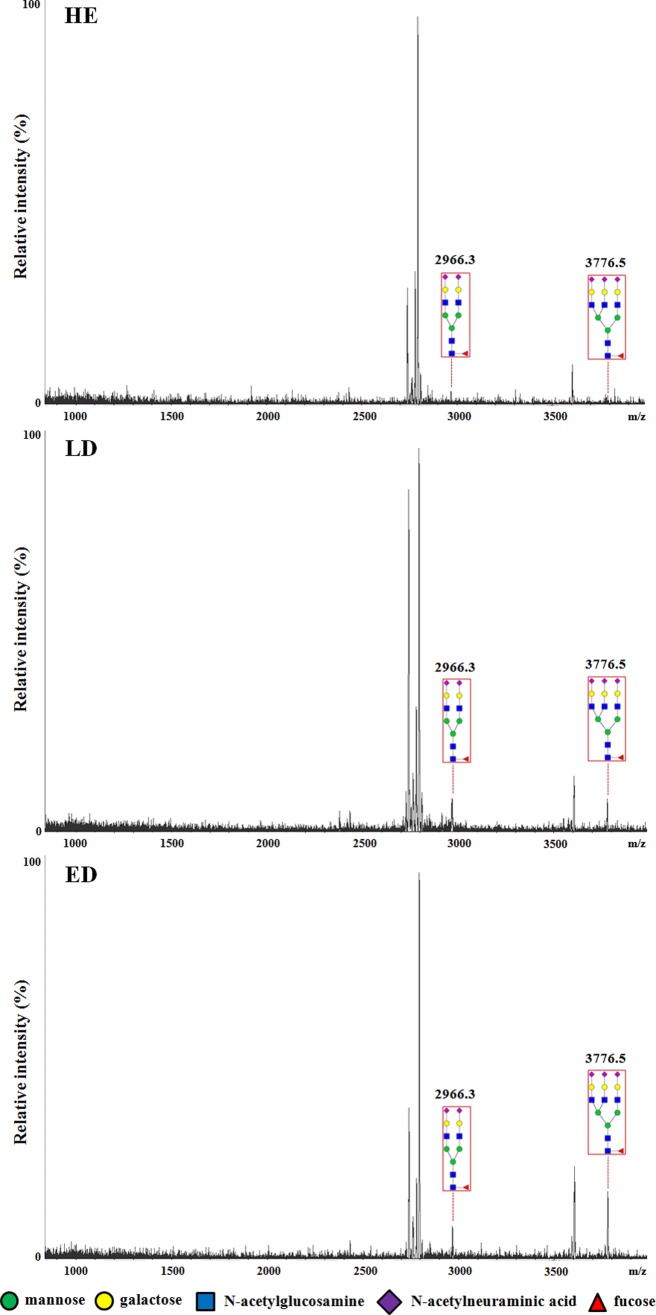
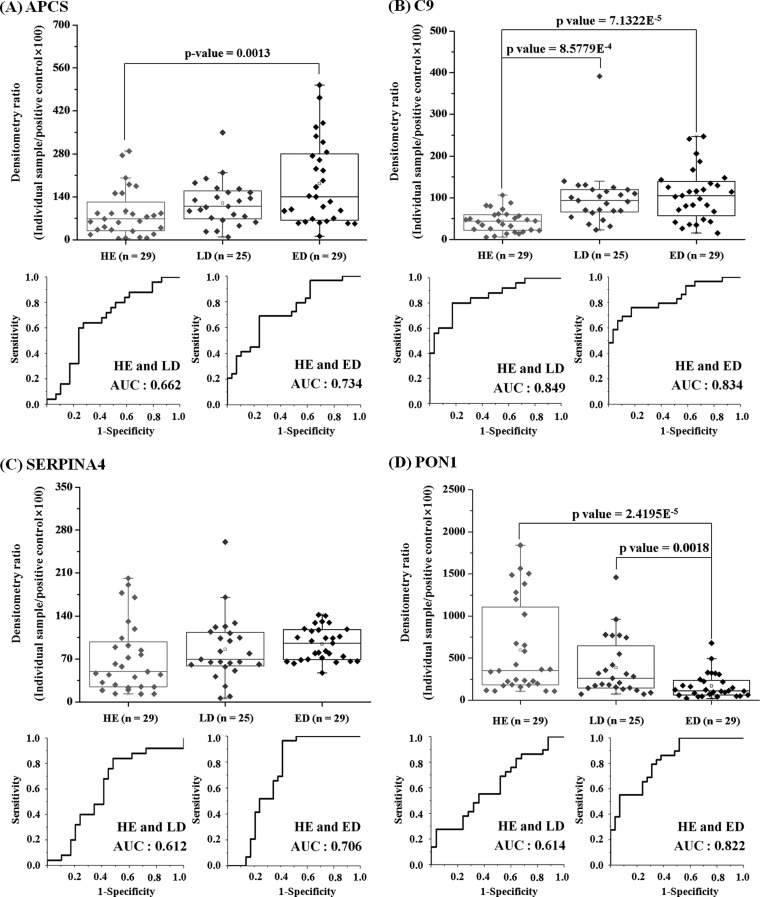
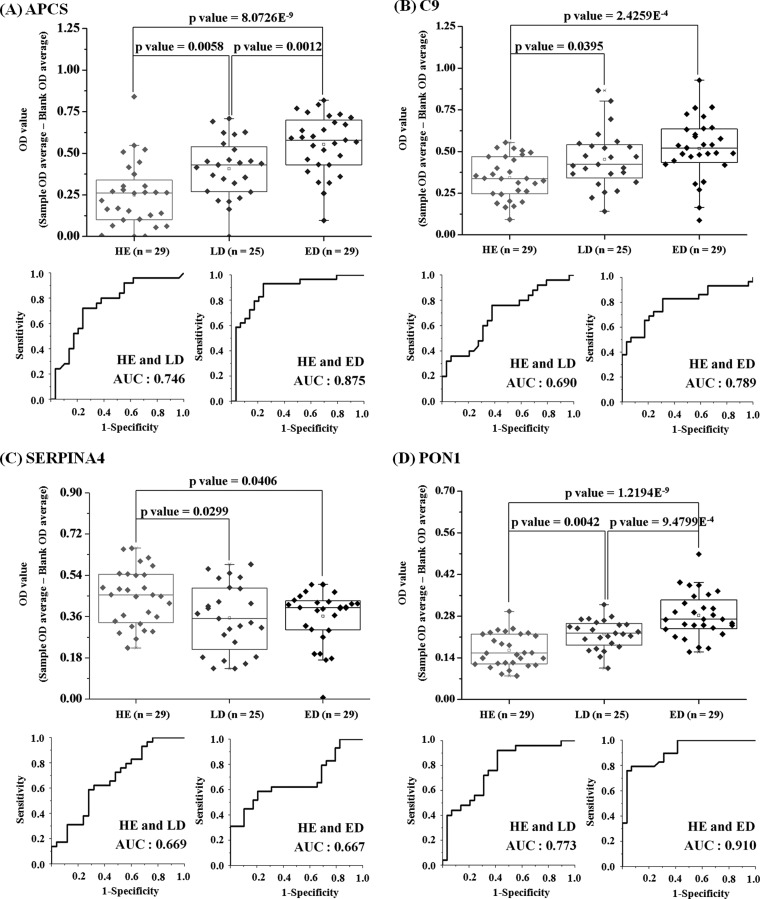
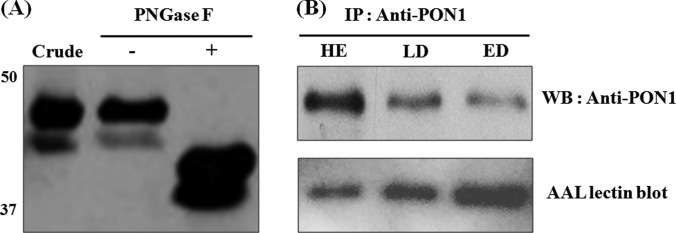
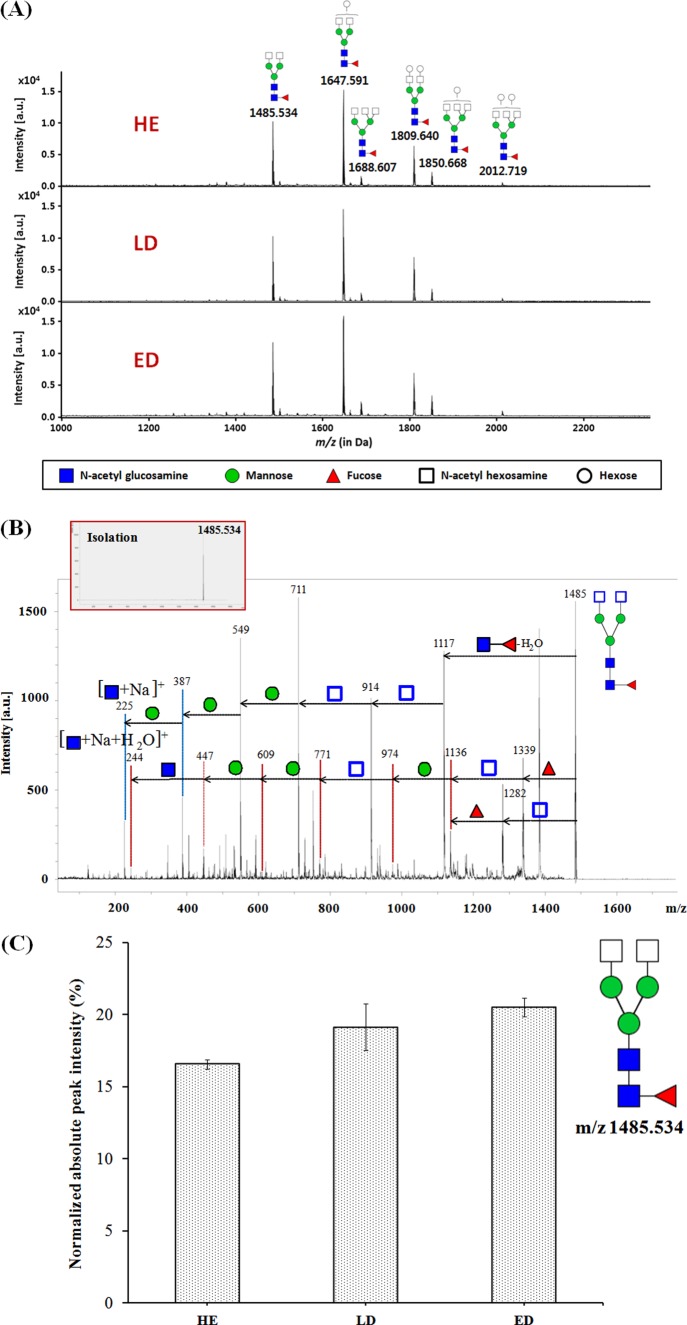
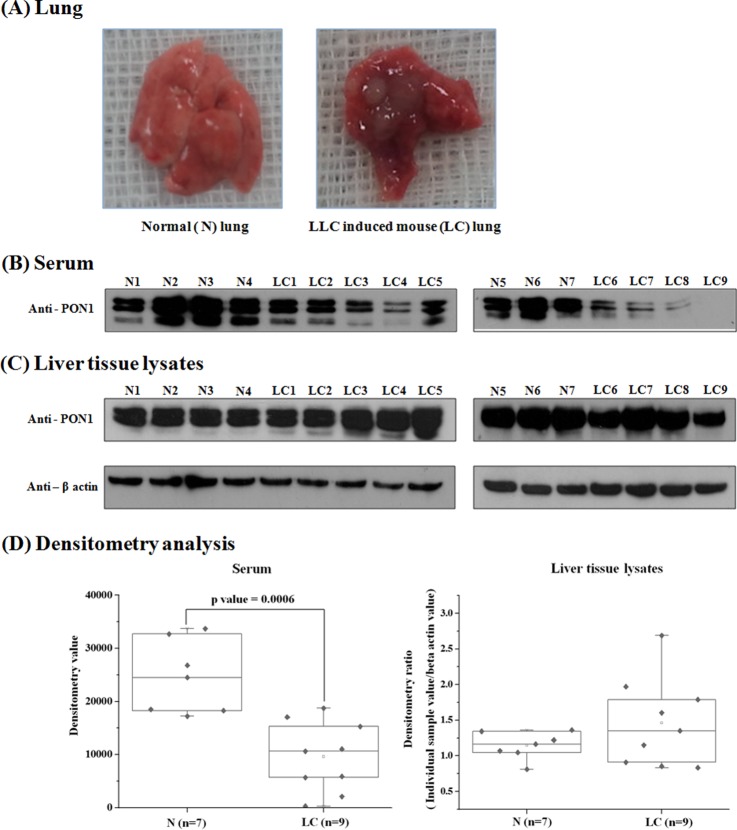
Small cell lung cancer (SCLC) is an aggressive type of lung cancer, and the detection of SCLCs at an early stage is necessary for successful therapy and for improving cancer survival rates. Fucosylation is one of the most common glycosylation-based modifications. Increased levels of fucosylation have been reported in a number of pathological conditions, including cancers. In this study, we aimed to identify and validate the aberrant and selective fucosylated glycoproteins in the sera of patients with SCLC. Fucosylated glycoproteins were enriched by the Aleuria aurantia lectin column after serum albumin and IgG depletion. In a narrowed down and comparative data analysis of both label-free proteomics and isobaric peptide-tagging chemistry iTRAQ approaches, the fucosylated glycoproteins were identified as up- or down-regulated in the sera of limited disease and extensive disease stage patients with SCLC. Verification was performed by multiple reaction monitoring-mass spectrometry to select reliable markers. Four fucosylated proteins, APCS, C9, SERPINA4, and PON1, were selected and subsequently validated by hybrid A. aurantia lectin ELISA (HLE) and Western blotting. Compared with Western blotting, the HLE analysis of these four proteins produced more optimal diagnostic values for SCLC. The PON1 protein levels were significantly reduced in the sera of patients with SCLC, whereas the fucosylation levels of PON1 were significantly increased. Fucosylated PON1 exhibited an area under curve of 0.91 for the extensive disease stage by HLE, whereas the PON1 protein levels produced an area under curve of 0.82 by Western blot. The glycan structural analysis of PON1 by MS/MS identified a biantennary fucosylated glycan modification consisting of a core + 2HexNAc + 1Fuc at increased levels in the sera of patients with SCLC. In addition, the PON1 levels were decreased in the sera of the Lewis lung carcinoma lung cancer mouse model that we examined. Our data suggest that fucosylated protein biomarkers, such as PON1, and their fucosylation levels and patterns can serve as diagnostic and prognostic serological markers for SCLC.


Figures

Fig. 1.
Fig. 1.
Schematic representation of the fucosylated glycoproteomics approach for the discovery of serum biomarkers in patients with SCLC. The 5 and (later) 10 pooled serum samples (total 500 μl) from healthy control individuals (HE), limited disease (LD) and extensive disease (ED) stage patients with SCLC were subjected to albumin and IgG depletion, followed by enrichment for the fucosylated glycoproteins using AAL columns. The proteomic profiling of the fucosylated glycoproteins was performed using label-free and iTRAQ labeling analysis using MS. Both proteomic methods (label-free and iTRAQ) were analyzed by two or three technical replicates, respectively. To select the promising candidates for validation, data filtration, comparative data analysis, and small scale verification using LC-MRM-MS analysis were performed on the identified list from both label-free and iTRAQ labeling approaches. The levels of the candidate proteins and their altered fucosylation were verified by Western blot (WB) and hybrid AAL ELISA (HLE) analyses. The 10 pooled serum samples were subjected to N-linked glycan profiling and structural analysis.
Fig. 2.
Fig. 2.
SDS-PAGE analysis of the albumin- and IgG-depleted and AAL-captured glycoproteins from the pooled serum samples of HE and patients with SCLC. A, pattern check of the albumin- and IgG-depleted human serum samples. The pooled sera from HE, LD, and ED patients were depleted of albumin and IgG using immunoaffinity columns, followed by SDS-PAGE. The purified proteins were visualized by Coomassie Brilliant Blue staining. T, total crude sera; B, albumin and IgG column-bound proteins; D, albumin- and IgG-depleted sera. The most prominent removal was observed in serum albumin (∼66 kDa), which represents ∼50% of the total protein content in crude sera. The IgG heavy chain (∼55 kDa) was also efficiently removed. B, depleted sera were enriched for fucosylated glycoproteins using AAL columns. The flow-through and the AAL-bound fucosylation enriched-proteins were visualized by Coomassie Brilliant Blue staining. Flow-through, AAL column unbound proteins; Elution, AAL column-bound proteins. C, visualization of the same samples from B was performed by AAL blot analysis using biotinylated AAL and horseradish peroxidase-conjugated streptavidin.
Fig. 3.
Fig. 3.
Schematic workflow of narrowing down and comparative data analysis between the label-free and iTRAQ labeling proteomics approaches for the discovery of serum biomarker candidates in SCLC samples. A, all of the data from the label-free and iTRAQ approaches were filtered using two steps to narrow down the candidate list of potential SCLC-selective fucosylated glycoprotein biomarkers. In the first filtration, contaminant proteins, uncharacterized proteins, and immunoglobulins are excluded out from the total list of identified proteins in two approaches. In the second filtration, glycoproteins that have potential N- or O-linked glycosylation sites are selected. B, filtrated proteins are quantified. The label-free approach was performed in duplicate, and the iTRAQ labeling approach was performed in triplicate. The proteins that were identified in both approaches to exhibit greater than 1.3- or 1.5-fold changes of label-free average TIC or iTRAQ reporter ion intensity ratios in the LD and ED samples compared with the HE samples were selected for further analysis.
Fig. 4.
Fig. 4.
N-Linked glycan analysis of depleted sera by MALDI-TOF MS. N-Linked glycan profiling analysis was performed to select the N-glycosylated proteins in the SCLC patient serum samples for further analysis. Total N-linked glycans were released from the glycoproteins by the addition of peptide N-glycosidase F to the depleted HE, LD, and ED serum samples (500 μl each). The released N-linked glycans were permethylated and analyzed by MALDI-TOF MS. The main N-linked glycan peak differences between the HE and SCLC samples were the core fucosylated bi- and triantennary glycans (2,966.3 and 3,776.5 m/z). All of the N-linked glycans are presented in supplemental Table 7.
Fig. 5.
Fig. 5.
Verification of the four selected biomarker candidates by immunoblot and ROC analyses. Western blots of the individual crude sera from the 29 HE, 25 LD and 29 ED patients samples were subjected to densitometry analysis. Densitometric analysis of the WB bands was performed using Scion Image. ROCs were constructed for the four target proteins, as described under “Experimental Procedures.” The densitometric ratio values were calculated as the densitometric value for an individual sample divided by the normalization control value × 100, in which the normalization control was the densitometric value for the five pooled ED-positive control samples. A, APCS. B, C9. C, kallistatin (SERPINA4). D, serum PON1. The p values were calculated using Origin program, as described under “Experimental Procedures.”
Fig. 6.
Fig. 6.
Fucosylated glycoprotein alterations as indicated by HLE and ROC analyses. HLE analyses were performed in triplicate for the detection of fucosylated APCS, C9, SERPINA4, and PON1 from the 29 HE, 25 LD, and 29 ED crude serum samples. See under “Experimental Procedures” for the development of the HLE. ROCs were also constructed for the four fucosylated target proteins. A, APCS. B, C9. C, kallistatin (SERPINA4). D, serum PON1. The p values were calculated using nonparametric Kruskal-Wallis analysis of variance. The p values were calculated using Origin program, as described under “Experimental Procedures.”
Fig. 7.
Fig. 7.
PON1 protein in the sera of the patients with SCLC is highly reactive with fucose-binding lectin. A, serum samples treated with or without PNGase F were analyzed by immunoblotting using a PON1 antibody. The PNGase F treatment reduced the size of the PON1 protein, indicating that the PON1 protein was N-linked glycosylated. Crude, five pooled HE crude sera; −, PNGase F-untreated crude sample; +, PNGase F-treated crude sample. B, comparison of the fucosylation levels of PON1 in the HE, LD, and ED samples. Upper panel, after the immunoprecipitation and purification of PON1 from the depleted serum samples, the same volumes of eluted protein were subjected to SDS-PAGE (12% gel), followed by Western blotting analysis using anti-PON1 antibody. Lower panel, reblotting of the same membrane using biotinylated AAL, followed by HRP-conjugated streptavidin for the detection of the levels of fucosylated PON1 protein.
Fig. 8.
Fig. 8.
Structural and quantitative analyses of the N-linked glycans in the PON1 protein. A, fucosylated N-linked glycan profiling of PON1 protein. PON1 protein was purified from the HE, LD, and ED samples by immunoprecipitation, and the N-linked glycans were released by PNGase F treatment. The purified N-linked glycans from PON1 were analyzed by MALDI-MS. B, representative structural data for the ion at m/z 1,485 by tandem MS. C, biantennary fucosylated glycan consisting of core + 2HexNAc + 1Fuc was readily altered between the HE control to the ED SCLC patient samples. The analysis of the fucosylated glycans from the PON1 glycoprotein was performed in duplicate by Chip-QTOF nano-LC-MS.
Fig. 9.
Fig. 9.
PON1 protein was reduced in the sera of the LLC mice. For the in vivo analysis of the serum and liver PON1 protein levels, mice were inoculated with either LLC lung cancer cells (1 × 10⁶) or PBS (normal control) through the tail vain. A, resected lungs at 32 days after PBS or LLC inoculation. The tumor multiplicity is shown in an LLC mouse lung. B and C, PON1 protein levels were analyzed in the sera (B) and the liver tissue lysates (C) of the mice by immunoblotting. D, densitometric analysis of the WB bands was performed. The densitometric value ratios were calculated by dividing the densitometric value for an individual liver tissue lysate sample with the normalization control (β-actin) value. The PON1 levels in the sera were decreased, whereas the levels in liver remained unchanged.

Similar articles

Cited by

References

    1. Carney D. N., Gazdar A. F., Nau M., Minna J. D. (1985) Biological heterogeneity of small cell lung cancer. Semin. Oncol. 12, 289–303 - PubMed
    1. Shimosato Y., Nakajima T., Hirohashi S., Morinaga S., Terasaki T., Yamaguchi K., Saijo N., Suemasu K. (1986) Biological, pathological and clinical features of small cell lung cancer. Cancer Lett. 33, 241–258 - PubMed
    1. Parkin D. M., Bray F., Ferlay J., Pisani P. (2005) Global cancer statistics, 2002. CA Cancer J. Clin. 55, 74–108 - PubMed
    1. Rudin C. M., Hann C. L., Peacock C. D., Watkins D. N. (2008) Novel systemic therapies for small cell lung cancer. J. Natl. Compr. Canc. Netw. 6, 315–322 - PMC - PubMed
    1. Chen L. C., Travis W. D., Krug L. M. (2006) Pulmonary neuroendocrine tumors: What (little) do we know? J. Natl. Compr. Canc. Netw. 4, 623–630 - PubMed

Publication types