Whisker movements reveal spatial attention: a unified computational model of active sensing control in the rat
- PMID: 24086120
- PMCID: PMC3784505
- DOI: 10.1371/journal.pcbi.1003236
Whisker movements reveal spatial attention: a unified computational model of active sensing control in the rat
Abstract
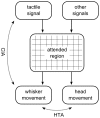
Spatial attention is most often investigated in the visual modality through measurement of eye movements, with primates, including humans, a widely-studied model. Its study in laboratory rodents, such as mice and rats, requires different techniques, owing to the lack of a visual fovea and the particular ethological relevance of orienting movements of the snout and the whiskers in these animals. In recent years, several reliable relationships have been observed between environmental and behavioural variables and movements of the whiskers, but the function of these responses, as well as how they integrate, remains unclear. Here, we propose a unifying abstract model of whisker movement control that has as its key variable the region of space that is the animal's current focus of attention, and demonstrate, using computer-simulated behavioral experiments, that the model is consistent with a broad range of experimental observations. A core hypothesis is that the rat explicitly decodes the location in space of whisker contacts and that this representation is used to regulate whisker drive signals. This proposition stands in contrast to earlier proposals that the modulation of whisker movement during exploration is mediated primarily by reflex loops. We go on to argue that the superior colliculus is a candidate neural substrate for the siting of a head-centred map guiding whisker movement, in analogy to current models of visual attention. The proposed model has the potential to offer a more complete understanding of whisker control as well as to highlight the potential of the rodent and its whiskers as a tool for the study of mammalian attention.
Conflict of interest statement
The authors have declared that no competing interests exist.
Figures


 and
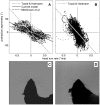
and  . Nearby obstacle (dark grey). Whisker base is located on ‘mystacial pad arc’ (dashed curve) which traces the snout outline (open dot marks arc center). Whisker shaft angle at the base, denoted
  , is defined with respect to head midline (dotted lines). Unperturbed whisker arc (upper solid line) intersects obstacle. Perturbed whisker arc (lower solid line) is found by adjusting curvature caudally until no intersection occurs. Deviation of point marked with solid dot from unperturbed to perturbed arc is denoted
  .
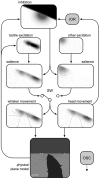
.
 . (Upper traces, axis to left) Thin dotted and solid lines indicate maximum retraction and protraction angles (
 and
and  ), respectively, for one whisker (the most rostral whisker on the left). Overlaid thick lines show the target protraction angle,
  , which is equal to
  or
or  depending on the value of
  (see Equation 9). Feint vertical lines show the time of oscillator ticks (times of falling edges in
  ). Actual whisker protraction angle,
  , is indicated by the dashed line and is driven towards
  . A sharp increase in maximum protraction angle occurs shortly before 0.5 s; this change is reflected in the whisker protraction angle most strongly during the subsequent protraction which ends at around 0.6 s.

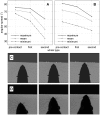
 , relative to the fovea of a single nearby wall (4 mm square bins). Red/white/blue indicates mean protraction angle is reduced/equal/increased relative to
  , with full saturation for each colour indicating
  difference. White semi-circle indicates 25 mm from fovea at
  , i.e. the region graphed in Figure 4c of Mitchinson et al. (2007) . (B) Results from behavioural experiment (in rat, , their Figure 4c), re-analysed on a rectangular grid to match current analysis. Electromyogram strength in NEAR, rather than mean protraction angle, is graphed, relative to mean electromyogram strength in FAR; fully saturated red/blue indicates 33% difference. (C/D) Stills from model (C) and behavioural experiment (D) showing asymmetry in bilateral protraction angles driven by encounter with angled surface. Still in (C) is taken from Video S6.
References
-
- Itti L, Koch C (2001) Computational modeling of visual attention. Nature Reviews Neuroscience 2: 194–203. - PubMed
-
- Eimer M, Driver J (2001) Crossmodal links in endogenous and exogenous spatial attention: evidence from event-related brain potential studies. Neuroscience & Biobehavioral Reviews 25: 497–511. - PubMed
-
- Berger A, Henik A, Rafal R (2005) Competition between endogenous and exogenous orienting of visual attention. Journal of Experimental Psychology: General 134: 207–221. - PubMed
-
- Wright RD, Ward LM (2008) Orienting of attention. Oxford University Press, USA.
-
- Hunt AR, Kingstone A (2003) Covert and overt voluntary attention: linked or independent? Cognitive Brain Research 18: 102–105. - PubMed
Publication types
MeSH terms
LinkOut - more resources
Full Text Sources
Other Literature Sources

