. 2013 Sep 27;8(9):e74341.
doi: 10.1371/journal.pone.0074341. eCollection 2013.

Plasma lipid profiling shows similar associations with prediabetes and type 2 diabetes

Affiliations

Plasma lipid profiling shows similar associations with prediabetes and type 2 diabetes

Peter J Meikle et al. PLoS One. .

Abstract

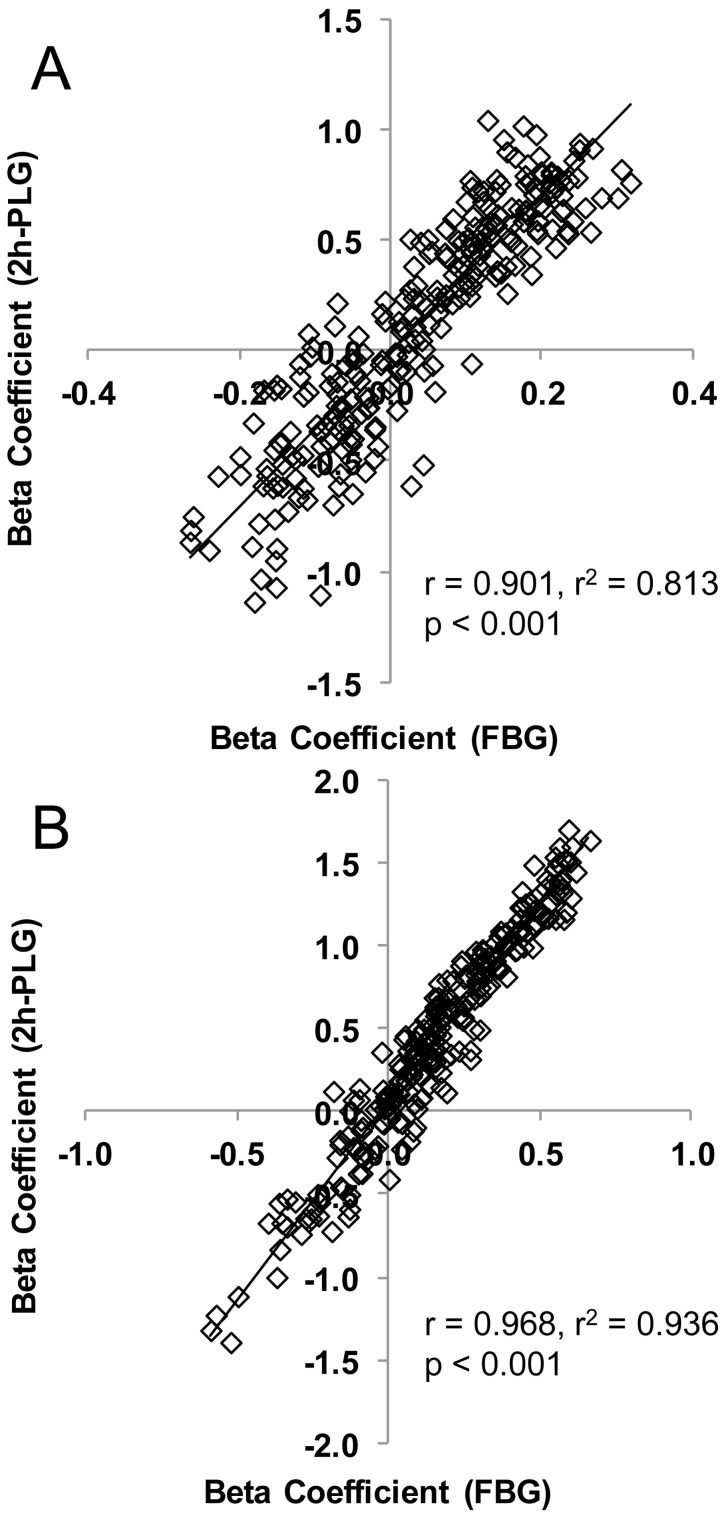
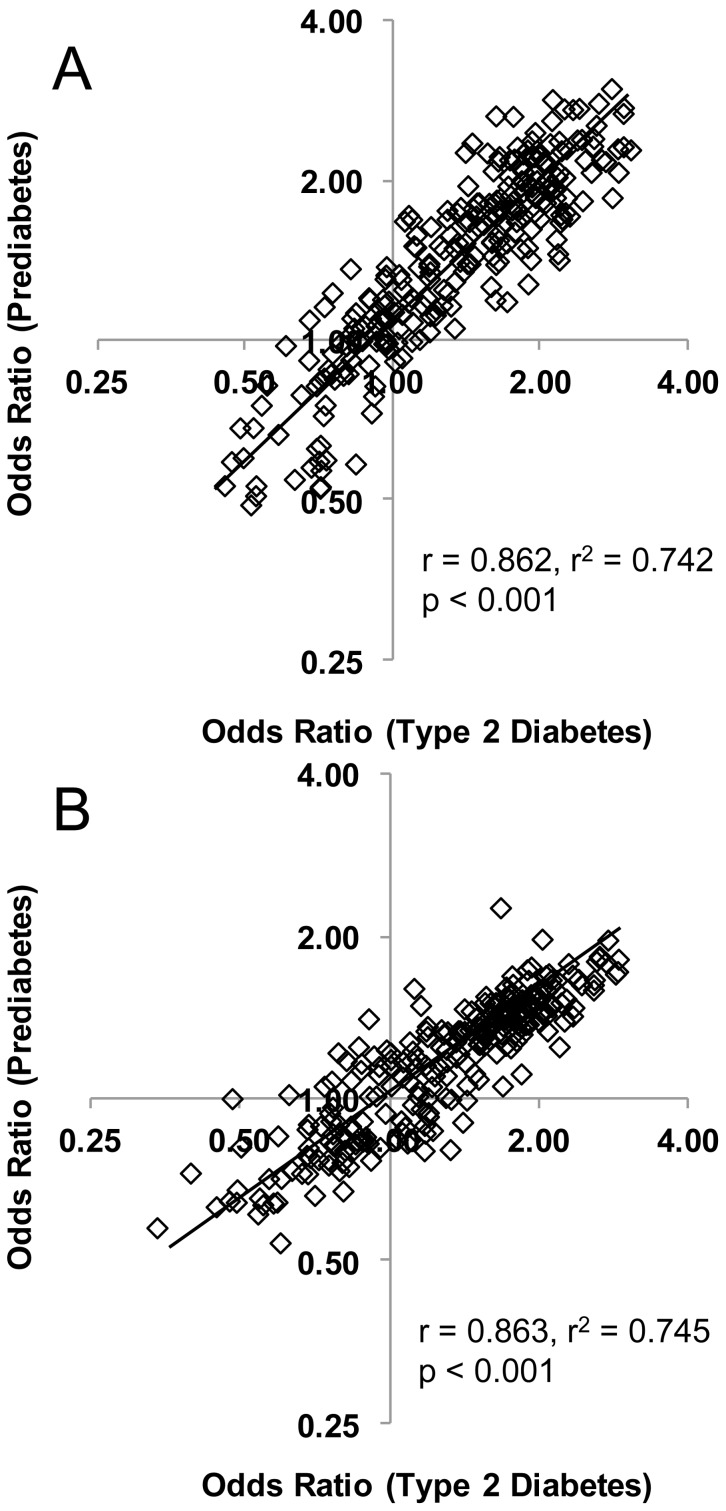
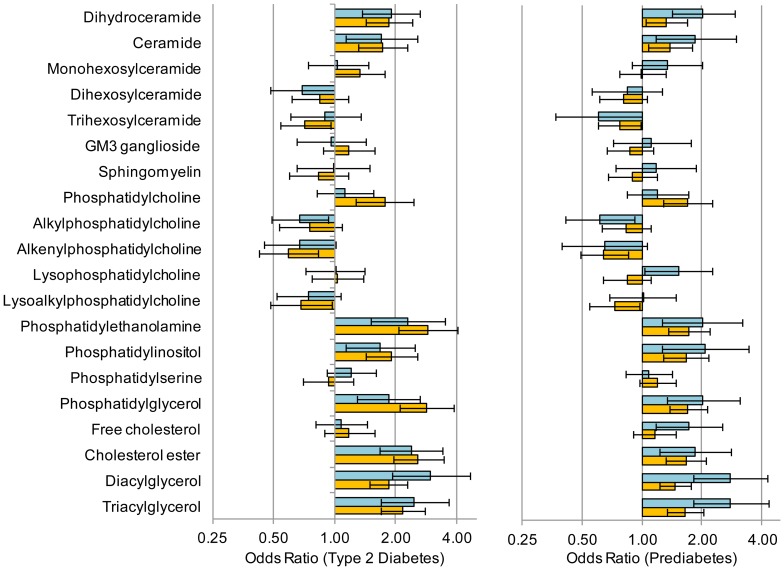
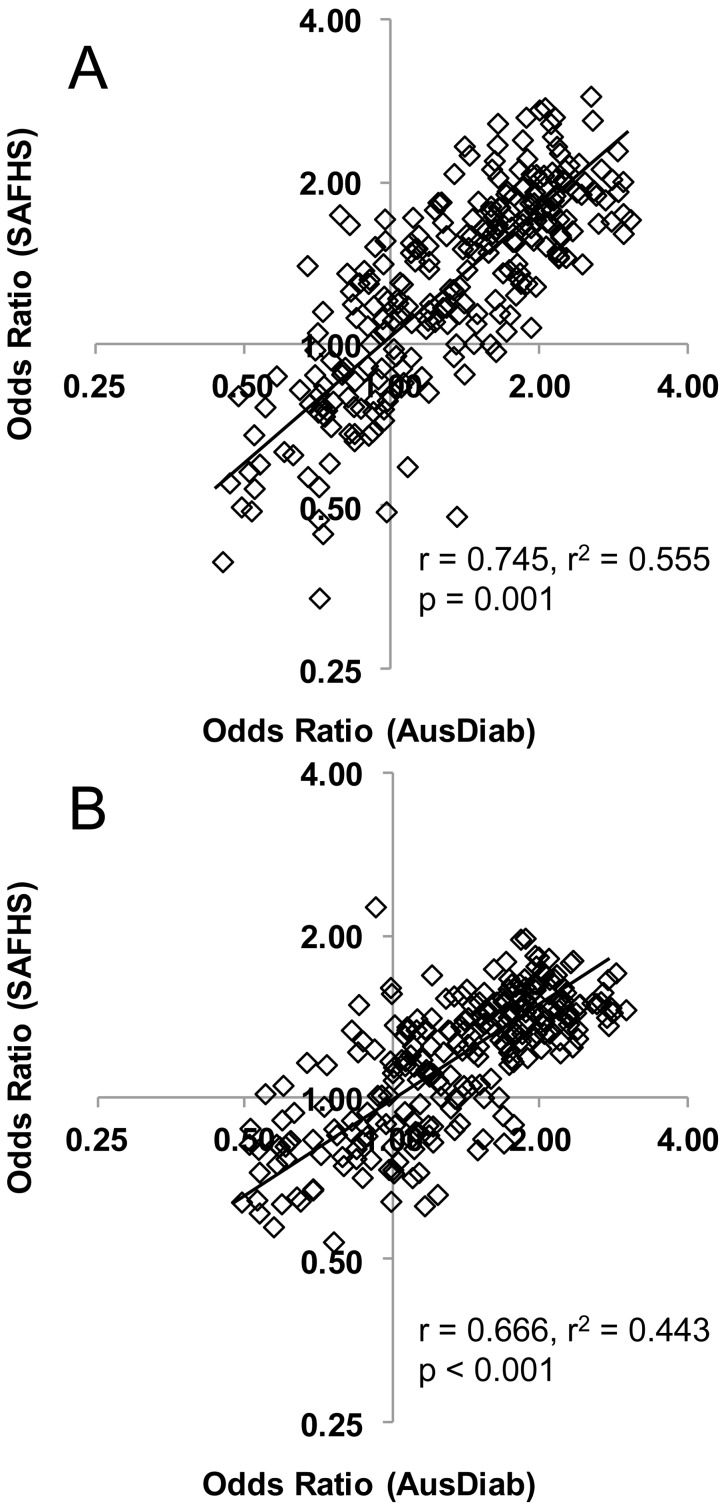
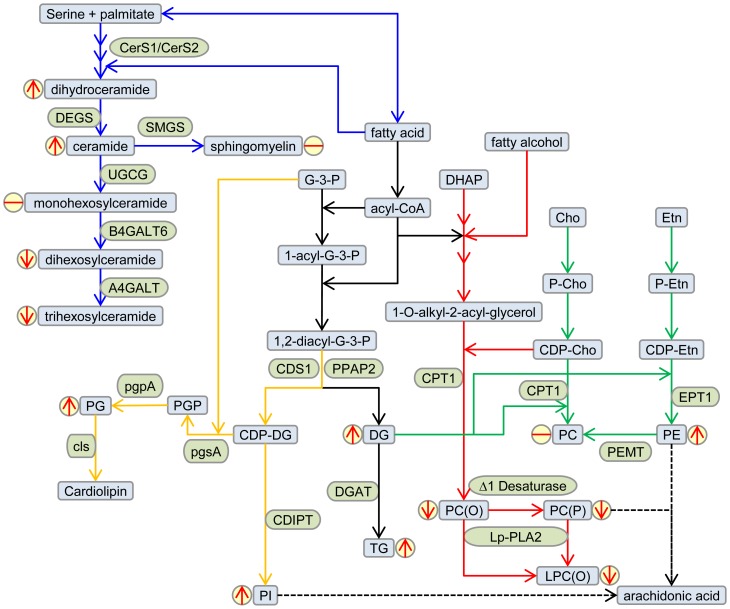
The relationship between lipid metabolism with prediabetes (impaired fasting glucose and impaired glucose tolerance) and type 2 diabetes mellitus is poorly defined. We hypothesized that a lipidomic analysis of plasma lipids might improve the understanding of this relationship. We performed lipidomic analysis measuring 259 individual lipid species, including sphingolipids, phospholipids, glycerolipids and cholesterol esters, on fasting plasma from 117 type 2 diabetes, 64 prediabetes and 170 normal glucose tolerant participants in the Australian Diabetes, Obesity and Lifestyle Study (AusDiab) then validated our findings on 1076 individuals from the San Antonio Family Heart Study (SAFHS). Logistic regression analysis of identified associations with type 2 diabetes (135 lipids) and prediabetes (134 lipids), after adjusting for multiple covariates. In addition to the expected associations with diacylglycerol, triacylglycerol and cholesterol esters, type 2 diabetes and prediabetes were positively associated with ceramide, and its precursor dihydroceramide, along with phosphatidylethanolamine, phosphatidylglycerol and phosphatidylinositol. Significant negative associations were observed with the ether-linked phospholipids alkylphosphatidylcholine and alkenylphosphatidylcholine. Most of the significant associations in the AusDiab cohort (90%) were subsequently validated in the SAFHS cohort. The aberration of the plasma lipidome associated with type 2 diabetes is clearly present in prediabetes, prior to the onset of type 2 diabetes. Lipid classes and species associated with type 2 diabetes provide support for a number of existing paradigms of dyslipidemia and suggest new avenues of investigation.


Conflict of interest statement

Competing Interests: The authors have declared that no competing interests exist.

Figures

Figure 1
Figure 1. The relationship between beta-coefficients (FPG) and beta-coefficients (2h-PLG) in AusDiab and SAFHS.
Linear regression of FPG and 2h-PLG on lipid species adjusted for age, sex, waist circumference and SBP were performed. Each data point represents a pair of the beta coefficients (FPG and 2h-PLG) for a single lipid species. Panel A – AusDiab; panel B – SAFHS.
Figure 2
Figure 2. The relationship between odds ratios (T2D) and odds ratios (prediabetes) in AusDiab and SAFHS.
Logistic regression of T2D and prediabetes on lipid species adjusted for age, sex, waist circumference and SBP were performed. Each data point represents a pair of the odds ratios (T2D and prediabetes) for a single lipid species. Panel A – AusDiab; panel B – SAFHS.
Figure 3
Figure 3. Associations of lipid classes with T2D and prediabetes in the AusDiab and SAHFS cohorts.
Logistic regression of T2D and prediabetes on lipid species adjusted for age, sex, waist circumference and SBP were performed. Bars show the odds ratio for each lipid class, whiskers are the 95% confidence intervals. Panel A – T2D vs. NGT; panel B – prediabetes vs. NGT. Dark bars – AusDiab; light bars – SAFHS.
Figure 4
Figure 4. The relationship between AusDiab and SAFHS in the odds ratios (T2D) and odds ratios (prediabetes).
Logistic regression of T2D and prediabetes on lipid species adjusted for age, sex, waist circumference and SBP were performed in the AusDiab and SAFHS cohorts. Each data point represents a pair of the odds ratios (AusDiab and SAFHS) for a single lipid species. Panel A – Odds ratios for T2D; panel B – Odds ratios for prediabetes.
Figure 5
Figure 5. Metabolic pathways altered in type 2 diabetes.
Partial lipid metabolic pathways show the major lipids associated with T2D (blue boxes) and the enzymes involved (green boxes). The sphingolipid (blue arrows), cardiolipin (orange arrows), triacylglycerol (black arrows), plasmalogen (red arrows) and phosphatidylcholine/phosphatidylethanolamine (green arrows) biosynthetic pathways are shown. The direction of association between lipids and T2D is indicated by the red arrows in yellow circles. Only partial pathways have been shown for clarity. Metabolite abbreviations: Cho, choline; DG, diacylglycerol; DHAP, dihydroxyacetonephosphate; Etn, ethanolamine; LPC(O), lysoalkylphosphatidylcholine; PC, phosphatidylcholine; PE, phosphatidylethanolamine; PC(O), alkylphosphatidylcholine; PC(P), alenylphosphatidylcholine; PG, phosphatidylglycerol; PGP, phosphatidylglycerolphosphate; PI, phosphatidylinositol; TG, triacylglycerol. Enzyme abbreviations: A4GALT, lactosylceramide 4-alpha-galactosyltransferase; B4GALT6, beta-1,4-galactosyltransferase 6; CDIPT, CDP-diacylglycerol-inositol 3-phosphatidyltransferase; CDS1, phosphatidate cytidylyltransferase; CerS, ceramide synthasecls, cardiolipin synthase; CPT1, diacylglycerol cholinephosphotransferase; DEGS, sphingolipid delta-4 desaturase; DGAT, diacylglycerol O-acyltransferase; EPT1, PEMT, phosphatidylethanolamine N-methyltransferase; ethanolaminephosphotransferase, pgpA, phosphatidylglycerophosphatase A; pgsA, CDP-diacylglycerol – glycerol-3-phosphate 3-phosphatidyltransferase; PPAP2, phosphatidate phosphatase; SMGS, sphingomyelin synthase; UGCG, ceramide glucosyltransferase.

References

    1. Magliano DJ, Shaw JE, Shortreed SM, Nusselder WJ, Liew D, et al. (2008) Lifetime risk and projected population prevalence of diabetes. Diabetologia 51: 2179–2186. - PubMed
    1. Haus JM, Kashyap SR, Kasumov T, Zhang R, Kelly KR, et al. (2009) Plasma ceramides are elevated in obese subjects with type 2 diabetes and correlate with the severity of insulin resistance. Diabetes 58: 337–343. - PMC - PubMed
    1. Meikle PJ, Wong G, Tsorotes D, Barlow CK, Weir JM, et al. (2011) Plasma lipidomic analysis of stable and unstable coronary artery disease. Arterioscler Thromb Vasc Biol 31: 2723–2732. - PubMed
    1. Kaddurah-Daouk R, Baillie RA, Zhu H, Zeng ZB, Wiest MM, et al. (2010) Lipidomic analysis of variation in response to simvastatin in the Cholesterol and Pharmacogenetics Study. Metabolomics 6: 191–201. - PMC - PubMed
    1. Huo T, Cai S, Lu X, Sha Y, Yu M, et al. (2009) Metabonomic study of biochemical changes in the serum of type 2 diabetes mellitus patients after the treatment of metformin hydrochloride. J Pharm Biomed Anal 49: 976–982. - PubMed

Publication types