

Population expansion and genetic structure in Carcharhinus brevipinna in the southern Indo-Pacific
- PMID: 24086462
- PMCID: PMC3783459
- DOI: 10.1371/journal.pone.0075169
Population expansion and genetic structure in Carcharhinus brevipinna in the southern Indo-Pacific
Erratum in
- PLoS One. 2014;9(4):e94738
Abstract
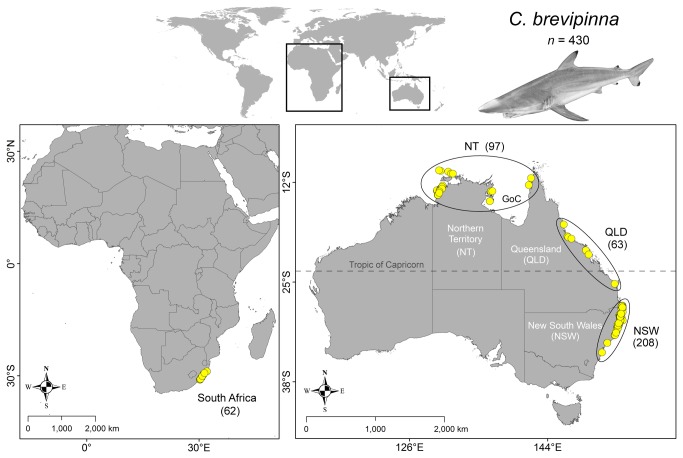
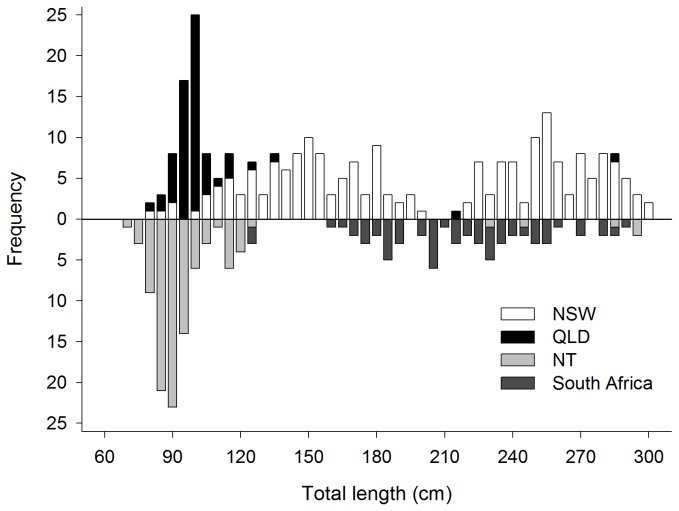
Background: Quantifying genetic diversity and metapopulation structure provides insights into the evolutionary history of a species and helps develop appropriate management strategies. We provide the first assessment of genetic structure in spinner sharks (Carcharhinus brevipinna), a large cosmopolitan carcharhinid, sampled from eastern and northern Australia and South Africa.
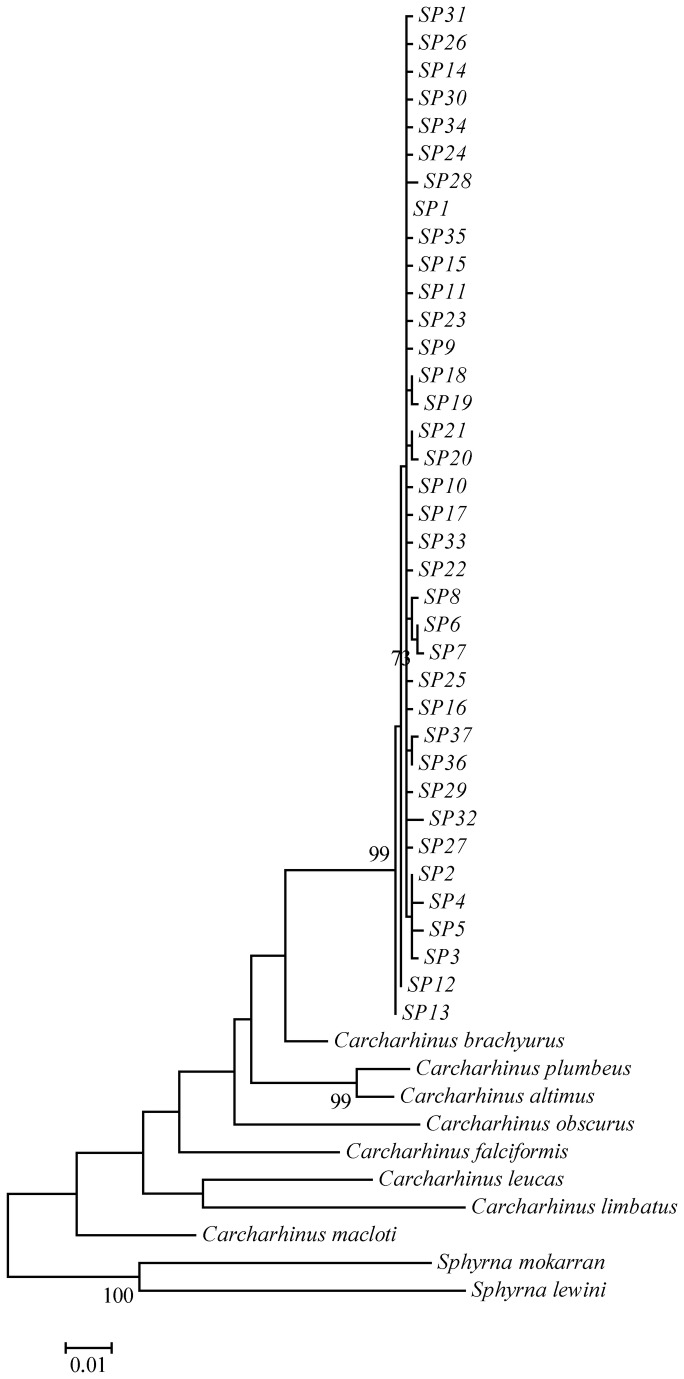
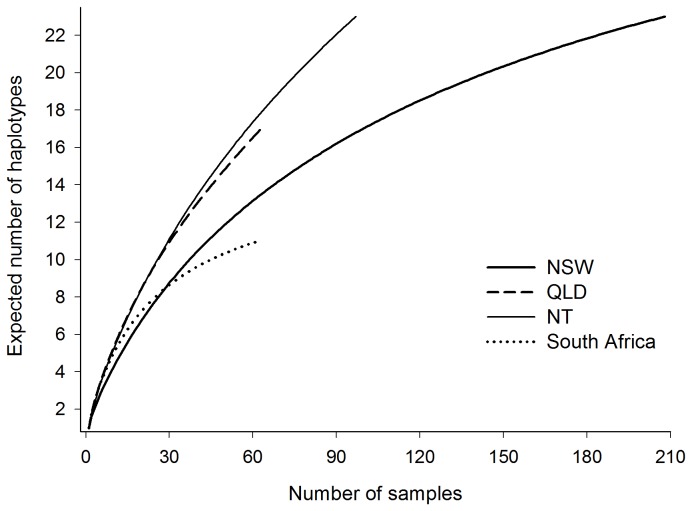
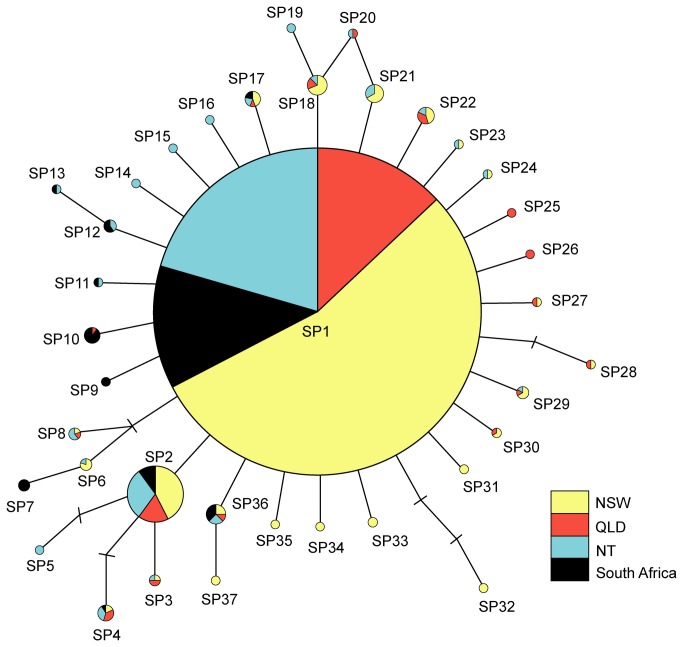
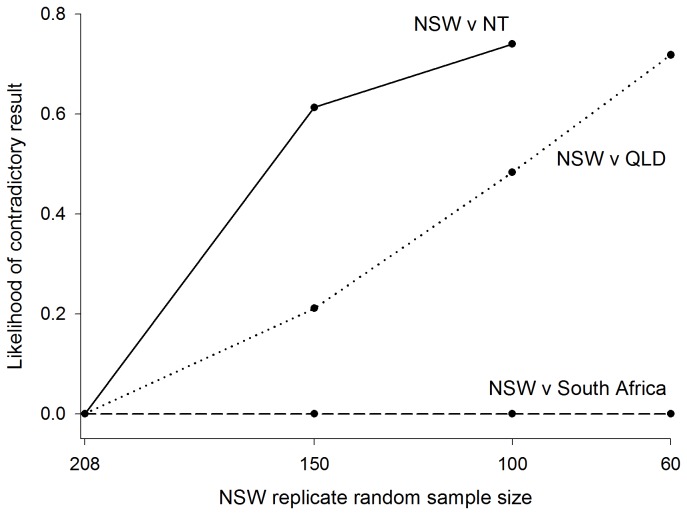
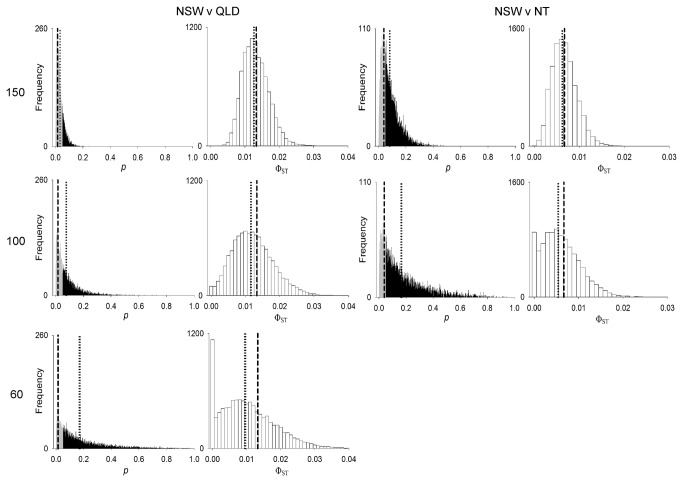
Methods and findings: Sequencing of the mitochondrial DNA NADH dehydrogenase subunit 4 gene for 430 individuals revealed 37 haplotypes and moderately high haplotype diversity (h = 0.6770 ±0.025). While two metrics of genetic divergence (ΦST and F ST) revealed somewhat different results, subdivision was detected between South Africa and all Australian locations (pairwise ΦST, range 0.02717-0.03508, p values ≤ 0.0013; pairwise F ST South Africa vs New South Wales = 0.04056, p = 0.0008). Evidence for fine-scale genetic structuring was also detected along Australia's east coast (pairwise ΦST = 0.01328, p < 0.015), and between south-eastern and northern locations (pairwise ΦST = 0.00669, p < 0.04).
Conclusions: The Indian Ocean represents a robust barrier to contemporary gene flow in C. brevipinna between Australia and South Africa. Gene flow also appears restricted along a continuous continental margin in this species, with data tentatively suggesting the delineation of two management units within Australian waters. Further sampling, however, is required for a more robust evaluation of the latter finding. Evidence indicates that all sampled populations were shaped by a substantial demographic expansion event, with the resultant high genetic diversity being cause for optimism when considering conservation of this commercially-targeted species in the southern Indo-Pacific.
Conflict of interest statement
Figures
References
-
- Nei M, Maruyama T, Chakraborty R (1975) The bottleneck effect and genetic variability in populations. Evolution 29: 1-10. doi:10.2307/2407137. - DOI - PubMed
-
- Excoffier L (1990) Evolution of human mitochondrial DNA: evidence for departure from a pure neutral model of populations at equilibrium. J Mol Evol 30: 125-139. doi:10.1007/BF02099939. PubMed: 1968979. - DOI - PubMed
-
- Lyrholm T, Leimar O, Gyllensten U (1996) Low diversity and biased substitution patterns in the mitochondrial DNA control region of sperm whales: implications for estimates of time since common ancestry. Mol Biol Evol 13: 1318-1326. doi:10.1093/oxfordjournals.molbev.a025578. PubMed: 8952076. - DOI - PubMed
-
- Zhang YP, Wang XX, Ryder OA, Li HP, Zhang HM et al. (2002) Genetic diversity and conservation of endangered animal species. Pure Appl Chem 74: 575-584. doi:10.1351/pac200274040575. - DOI
-
- Peakall R, Ebert D, Scott LJ, Meagher PF, Offord CA (2003) Comparative genetic study confirms exceptionally low genetic variation in the ancient and endangered relictual conifer, Wollemia nobilis (Araucariaceae). Mol Ecol 12: 2331-2343. doi:10.1046/j.1365-294X.2003.01926.x. PubMed: 12919472. - DOI - PubMed
Publication types
MeSH terms
Substances
LinkOut - more resources
Full Text Sources
Other Literature Sources
Research Materials
