

Consistent surgeon evaluations of three-dimensional rendering of PET/CT scans of the abdomen of a patient with a ductal pancreatic mass
- PMID: 24086475
- PMCID: PMC3782467
- DOI: 10.1371/journal.pone.0075237
Consistent surgeon evaluations of three-dimensional rendering of PET/CT scans of the abdomen of a patient with a ductal pancreatic mass
Abstract
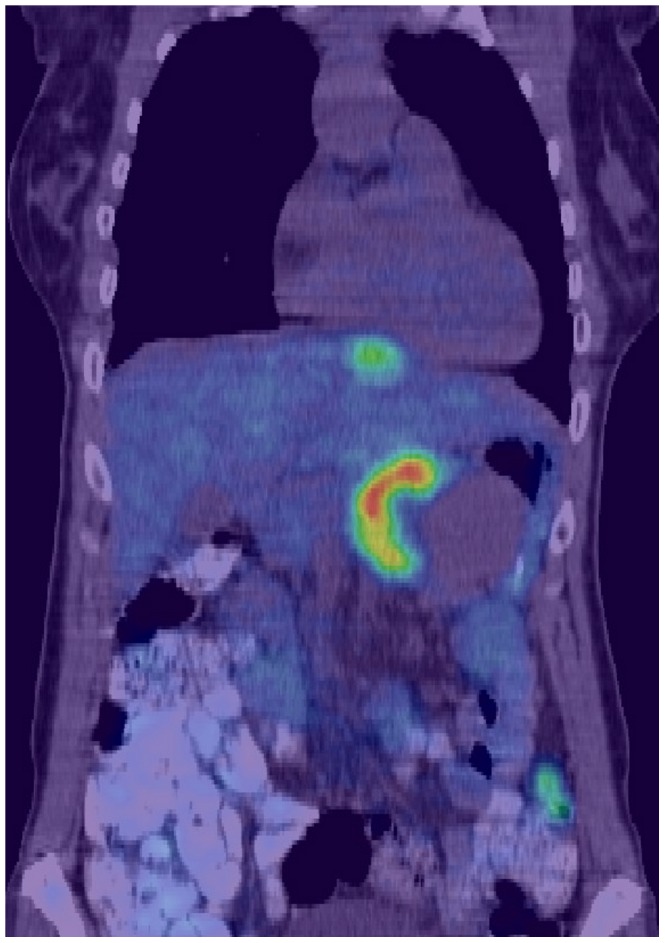
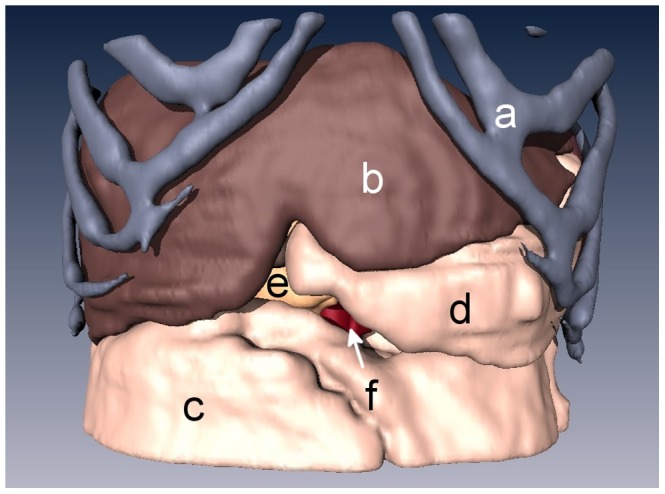
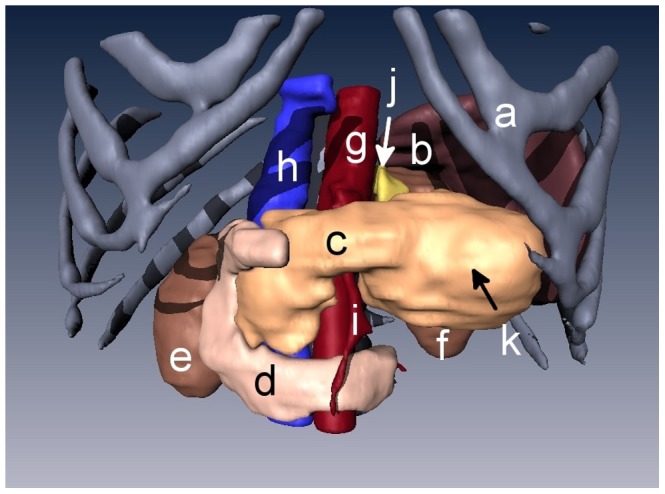
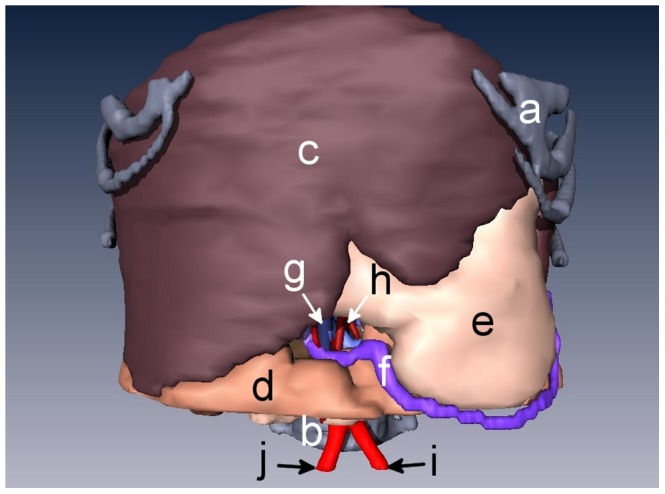
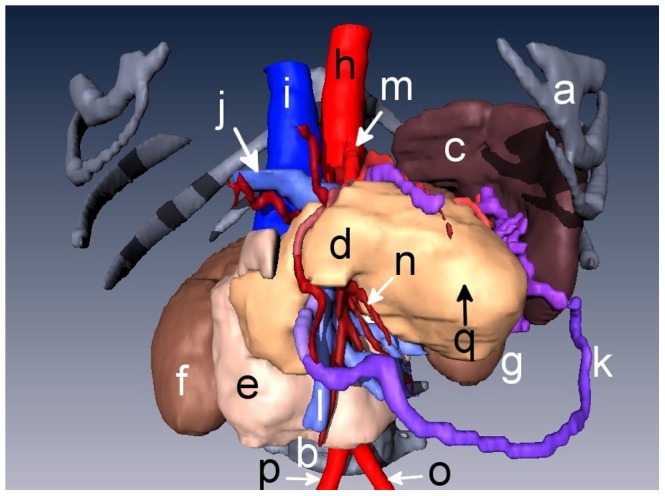
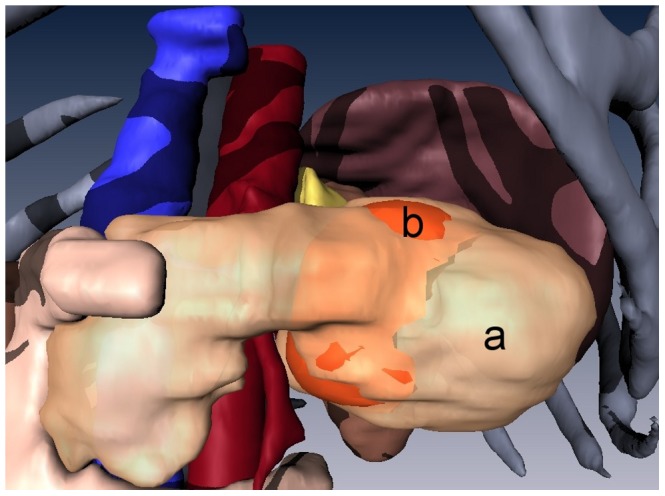
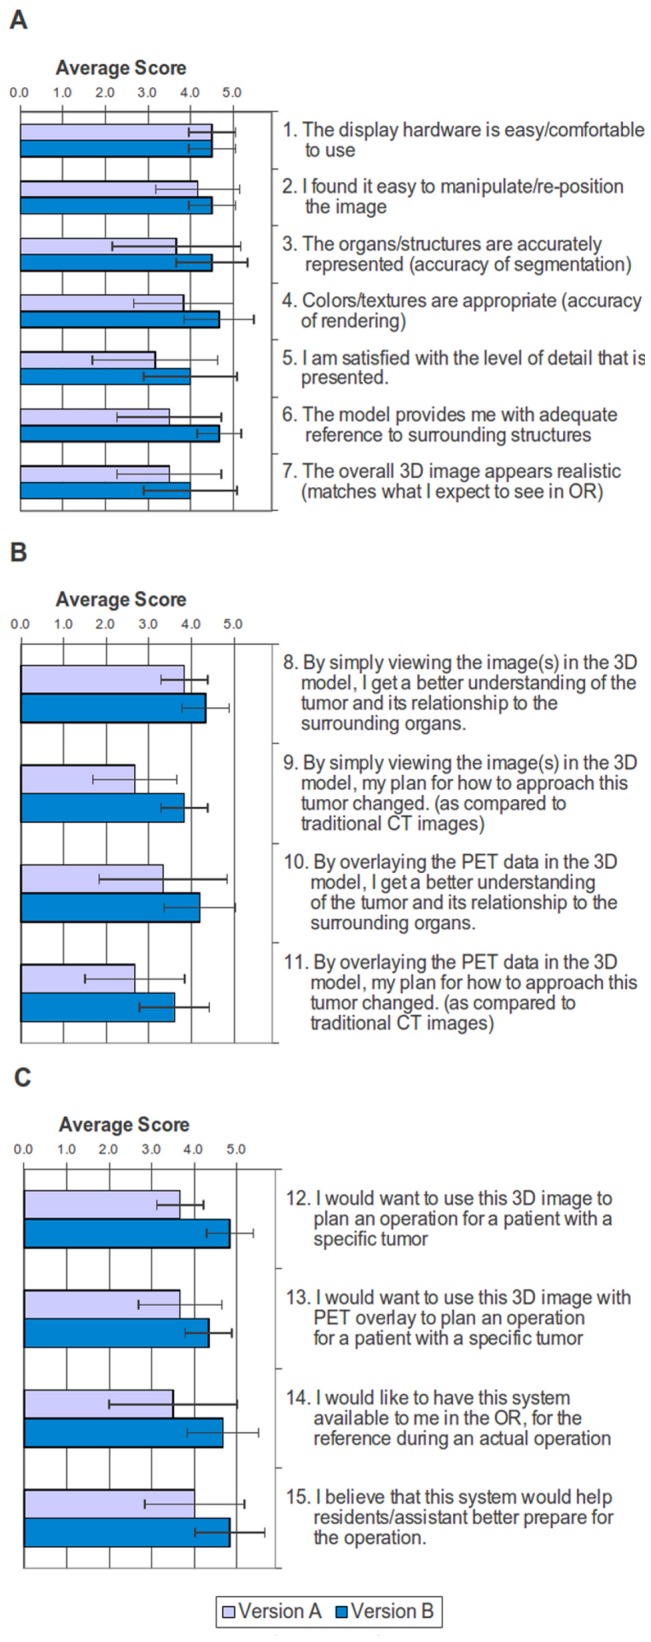
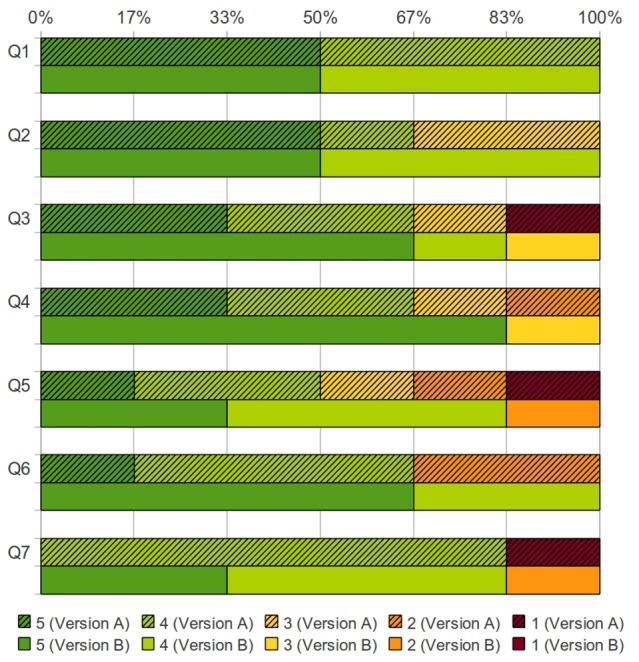
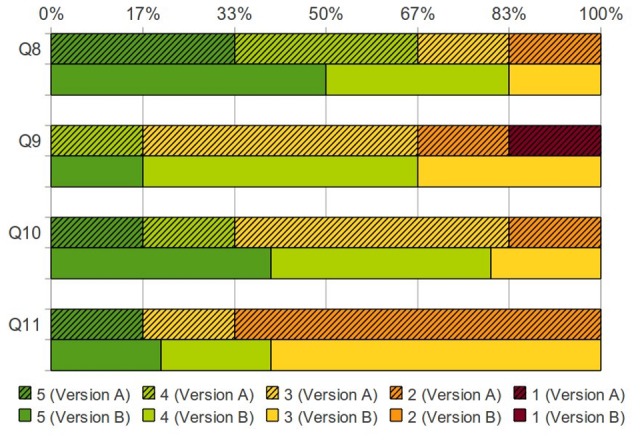
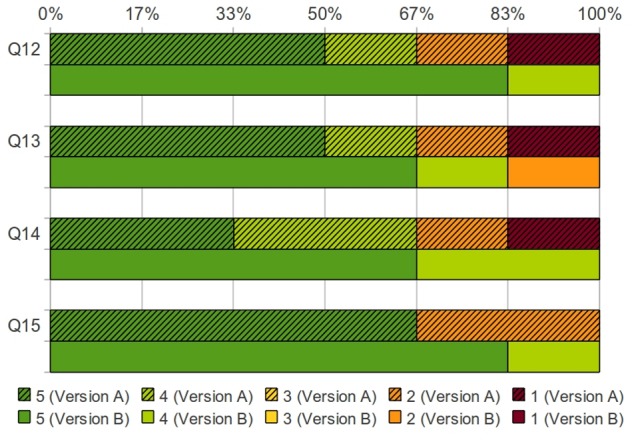
Two-dimensional (2D) positron emission tomography (PET) and computed tomography (CT) are used for diagnosis and evaluation of cancer patients, requiring surgeons to look through multiple planar images to comprehend the tumor and surrounding tissues. We hypothesized that experienced surgeons would consistently evaluate three-dimensional (3D) presentation of CT images overlaid with PET images when preparing for a procedure. We recruited six Jefferson surgeons to evaluate the accuracy, usefulness, and applicability of 3D renderings of the organs surrounding a malignant pancreas prior to surgery. PET/CT and contrast-enhanced CT abdominal scans of a patient with a ductal pancreatic mass were segmented into 3D surface renderings, followed by co-registration. Version A used only the PET/CT image, while version B used the contrast-enhanced CT scans co-registered with the PET images. The six surgeons answered 15 questions covering a) the ease of use and accuracy of models, b) how these models, with/without PET, changed their understanding of the tumor, and c) what are the best applications of the 3D visualization, on a scale of 1 to 5. The six evaluations revealed a statistically significant improvement from version A (score 3.6±0.5) to version B (score 4.4±0.4). A paired-samples t-test yielded t(14) = -8.964, p<0.001. Across the surgeon cohort, contrast-enhanced CT fused with PET provided a more lifelike presentation than standard CT, increasing the usefulness of the presentation. The experienced surgeons consistently reported positive reactions to 3D surface renderings of fused PET and contrast-enhanced CT scans of a pancreatic cancer and surrounding organs. Thus, the 3D presentation could be a useful preparative tool for surgeons prior to making the first incision. This result supports proceeding to a larger surgeon cohort, viewing prospective 3D images from multiple types of cancer.
Conflict of interest statement
Figures
Similar articles
-
Two-dimensional vs three-dimensional imaging in whole body oncologic PET/CT: a Discovery-STE phantom and patient study.Q J Nucl Med Mol Imaging. 2007 Sep;51(3):214-23. Epub 2007 Apr 30. Q J Nucl Med Mol Imaging. 2007. PMID: 17464266
-
Use of individualized 3D-printed models of pancreatic cancer to improve surgeons' anatomic understanding and surgical planning.Eur Radiol. 2023 Nov;33(11):7646-7655. doi: 10.1007/s00330-023-09756-0. Epub 2023 May 26. Eur Radiol. 2023. PMID: 37231071
-
Value of three-dimensional reconstructions in pancreatic carcinoma using multidetector CT: initial results.World J Gastroenterol. 2009 Dec 14;15(46):5827-32. doi: 10.3748/wjg.15.5827. World J Gastroenterol. 2009. PMID: 19998504 Free PMC article.
-
Efficacy of 3D-positron emission tomography/computed tomography for upper abdomen.J Hepatobiliary Pancreat Sci. 2014 Apr;21(4):246-50. doi: 10.1002/jhbp.83. Epub 2014 Jan 27. J Hepatobiliary Pancreat Sci. 2014. PMID: 24464609 Review.
-
Positron emission tomography modalities prevent futile radical resection of pancreatic cancer: A meta-analysis.Int J Surg. 2017 Oct;46:119-125. doi: 10.1016/j.ijsu.2017.09.003. Epub 2017 Sep 7. Int J Surg. 2017. PMID: 28890410 Review.
Cited by
-
Comparison of Cinematic Rendering and Computed Tomography for Speed and Comprehension of Surgical Anatomy.JAMA Surg. 2019 Aug 1;154(8):738-744. doi: 10.1001/jamasurg.2019.1168. JAMA Surg. 2019. PMID: 31141115 Free PMC article. Clinical Trial.
References
-
- Roach M 3rd, Alberini JL, Pecking AP, Testori A, Verrecchia F, et al. (2011) Diagnostic and therapeutic imaging for cancer: therapeutic considerations and future directions. J Surg Oncol 103: 587–601. - PubMed
-
- Tatsumi M, Isohashi K, Onishi H, Hori M, Kim T, et al. (2011) 18F-FDG PET/MRI fusion in characterizing pancreatic tumors: comparison to PET/CT. Int J Clin Oncol 16: 408–415. - PubMed
-
- Jadvar H, Fischman AJ (2001) Evaluation of pancreatic carcinoma with FDG PET. Abdominal Imaging 26: 254–259. - PubMed
Publication types
MeSH terms
Grants and funding
LinkOut - more resources
Full Text Sources
Other Literature Sources
Medical
Research Materials
