

Plant tissues in 3D via X-ray tomography: simple contrasting methods allow high resolution imaging
- PMID: 24086499
- PMCID: PMC3785515
- DOI: 10.1371/journal.pone.0075295
Plant tissues in 3D via X-ray tomography: simple contrasting methods allow high resolution imaging
Abstract
Computed tomography remains strongly underused in plant sciences despite its high potential in delivering detailed 3D phenotypical information because of the low X-ray absorption of most plant tissues. Existing protocols to study soft tissues display poor performance, especially when compared to those used on animals. More efficient protocols to study plant material are therefore needed. Flowers of Arabidopsis thaliana and Marcgravia caudata were immersed in a selection of contrasting agents used to treat samples for transmission electron microscopy. Grayscale values for floral tissues and background were measured as a function of time. Contrast was quantified via a contrast index. The thick buds of Marcgravia were scanned to determine which contrasting agents best penetrate thick tissues. The highest contrast increase with cytoplasm-rich tissues was obtained with phosphotungstate, whereas osmium tetroxide and bismuth tatrate displayed the highest contrast increase with vacuolated tissues. Phosphotungstate also displayed the best sample penetration. Furthermore, infiltration with phosphotungstate allowed imaging of all plants parts at a high resolution of 3 µm, which approaches the maximum resolution of our equipment: 1.5 µm. The high affinity of phosphotungstate for vasculature, cytoplasm-rich tissue, and pollen causes these tissues to absorb more X-rays than the surrounding tissues, which, in turn, makes these tissues appear brighter on the scan data. Tissues with different brightness can then be virtually dissected from each other by selecting the bracket of grayscale to be visualized. Promising directions for the future include in silico phenotyping and developmental studies of plant inner parts (e.g., ovules, vasculature, pollen, and cell nuclei) via virtual dissection as well as correlations of quantitative phenotypes with omics datasets. Therefore, this work represents a crucial improvement of previous methods, allowing new directions of research to be undertaken in areas ranging from morphology to systems biology.
Conflict of interest statement
Figures
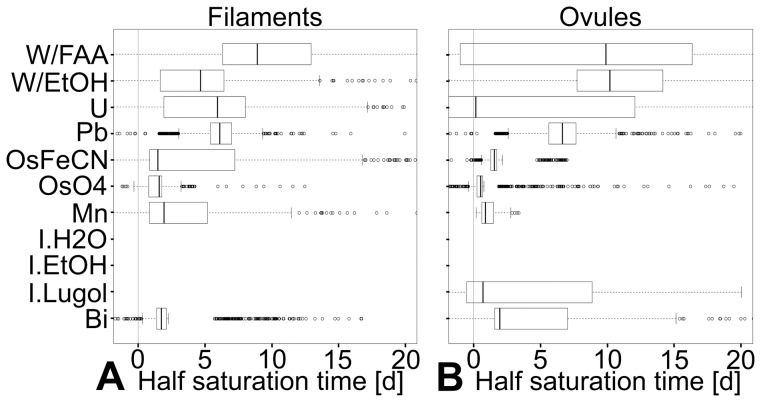
 (A) Half-saturation times distribution for stamen filaments. (B) Half-saturation times distribution for ovules. In both vacuolated and cytoplasmic tissues, the fastest and most consistent (narrow spread) reagents are the most reactive ones: permanganate and osmium tetroxide (both strong oxidants), and bismuth tartrate (which is in 2N sodium hydroxide). Although making for the highest contrast increase in cytoplasmic tissues, phosphotungstate appears relatively slow (due to high saturation values) and comparatively little reliable (large spread of half-saturation values). Abbreviations: Bi = bismuth tartrate; I.lugol = Lugol’s solution; Mn = potassium permanganate; OsO4 = osmium tetroxide; OsFeCN = osmium tetroxide with ferrocyanate; Pb = lead citrate; U = uranyl acetate; W/EtOH = phosphotungstate in 70% EtOH; W/FAA = phosphotungstate in FAA. Samples infiltrated with alcoholic and aqueous iodine are not detectable under the used scanning conditions.
References
-
- Bellaire A, Ischebeck T, Weinhäuser I, Staedler YM, Schönenberger J, et al.. (2012) The developmental trajectory of Arabidopsis flowers. 23rd International Conference on Arabidopsis Research. Vienna. pp. 178.
-
- van der Niet T, Zollikofer CPE, de Leon MSP, Johnson SD, Linder HP (2010) Three-dimensional geometric morphometrics for studying floral shape variation. Trends in Plant Science 15: 423–426. - PubMed
-
- Jiang N, Yang WN, Duan LF, Xu XC, Huang CL, et al. (2012) Acceleration of CT reconstruction for wheat tiller inspection based on adaptive minimum enclosing rectangle. Computers and Electronics in Agriculture 85: 123–133.
-
- Weninger WJ, Geyer SH, Mohun TJ, Rasskin-Gutman D, Matsui T, et al. (2006) High-resolution episcopic microscopy: a rapid technique for high detailed 3D analysis of gene activity in the context of tissue architecture and morphology. Anatomy and Embryology 211: 213–221. - PubMed
-
- Goebel JC, Bolbos R, Pinzano A, Schaeffer M, Rengle A, et al. (2008) In vivo rat knee cartilage volume measurement using quantitative high resolution MRI (7 T): feasibility and reproducibility. Biomed Mater Eng 18: 247–252. - PubMed
Publication types
MeSH terms
Substances
LinkOut - more resources
Full Text Sources
Other Literature Sources
