. 2013 Sep 25;8(9):e75527.
doi: 10.1371/journal.pone.0075527. eCollection 2013.

Febuxostat, an inhibitor of xanthine oxidase, suppresses lipopolysaccharide-induced MCP-1 production via MAPK phosphatase-1-mediated inactivation of JNK

Affiliations

Febuxostat, an inhibitor of xanthine oxidase, suppresses lipopolysaccharide-induced MCP-1 production via MAPK phosphatase-1-mediated inactivation of JNK

Johji Nomura et al. PLoS One. .

Abstract

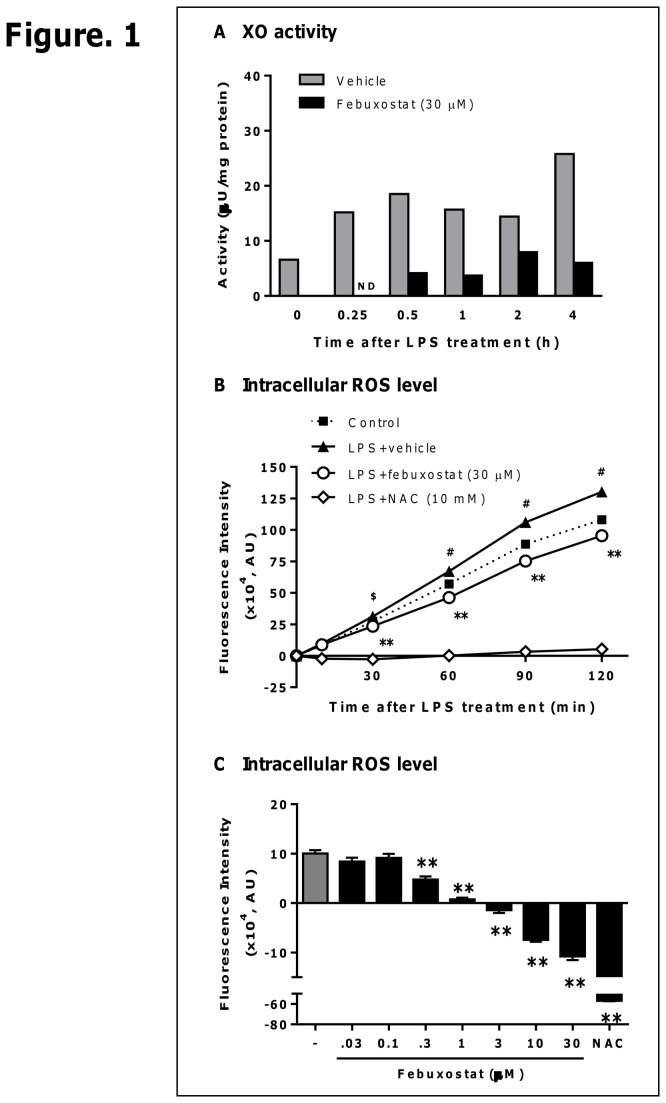
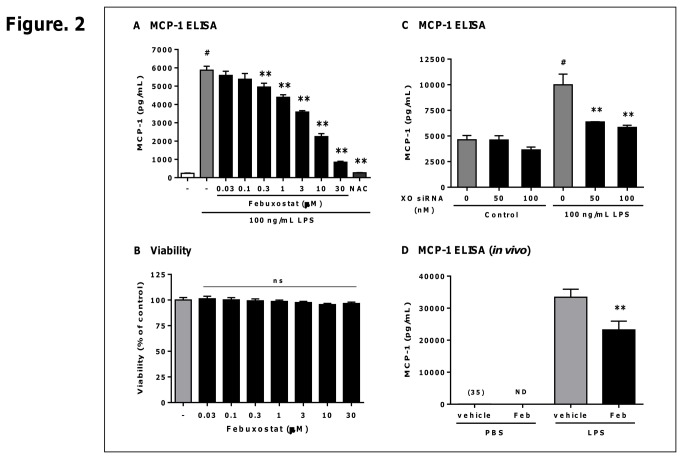
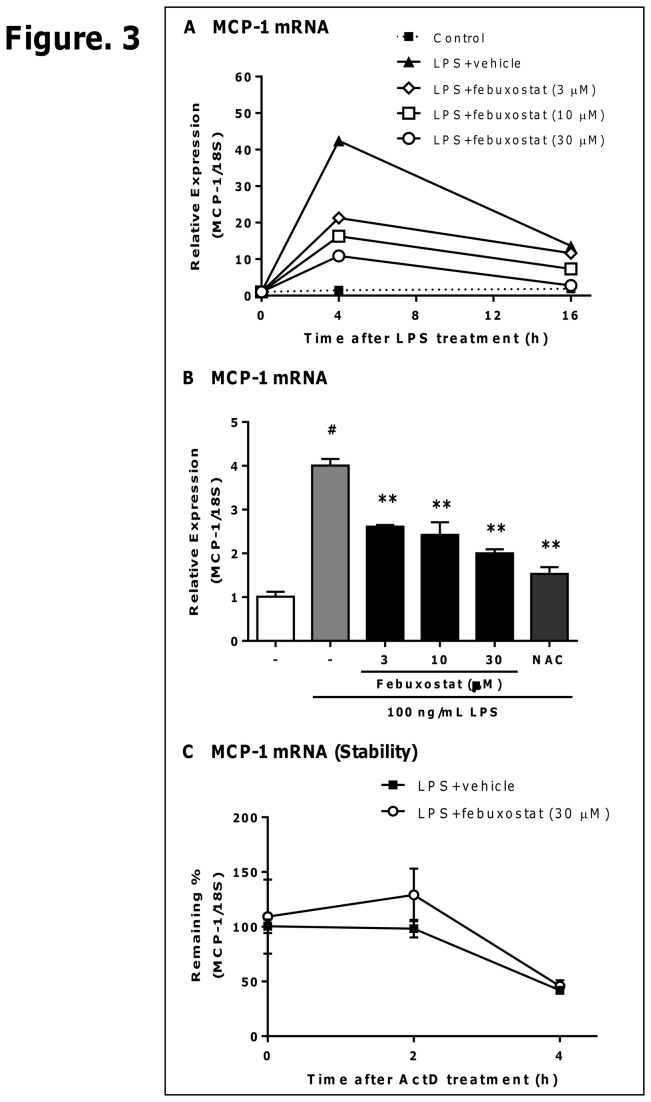
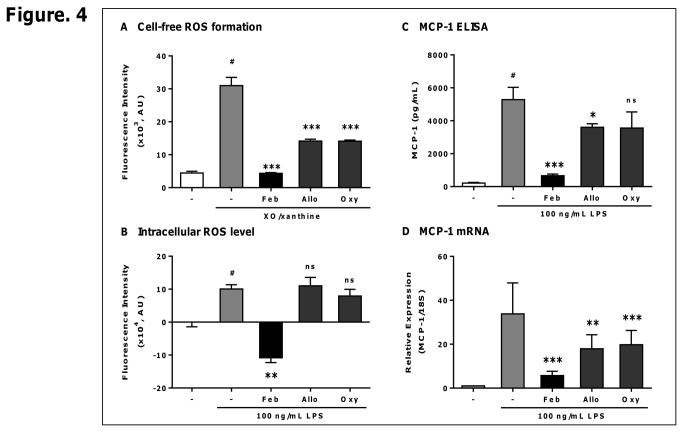
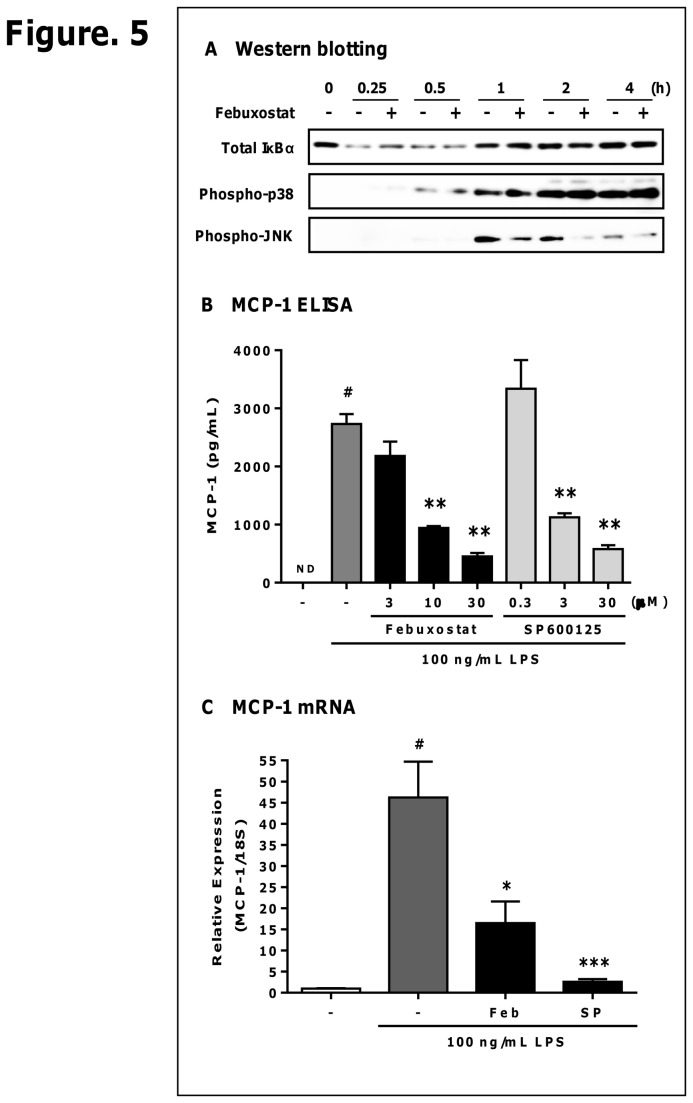
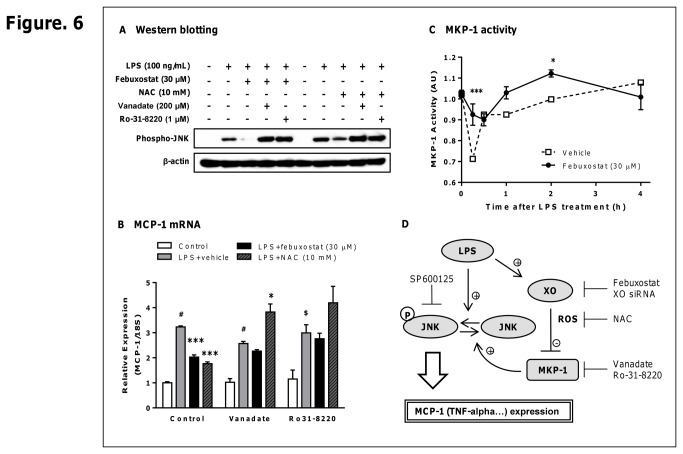
Excess reactive oxygen species (ROS) formation can trigger various pathological conditions such as inflammation, in which xanthine oxidase (XO) is one major enzymatic source of ROS. Although XO has been reported to play essential roles in inflammatory conditions, the molecular mechanisms underlying the involvement of XO in inflammatory pathways remain unclear. Febuxostat, a selective and potent inhibitor of XO, effectively inhibits not only the generation of uric acid but also the formation of ROS. In this study, therefore, we examined the effects of febuxostat on lipopolysaccharide (LPS)-mediated inflammatory responses. Here we show that febuxostat suppresses LPS-induced MCP-1 production and mRNA expression via activating MAPK phosphatase-1 (MKP-1) which, in turn, leads to dephosphorylation and inactivation of JNK in macrophages. Moreover, these effects of febuxostat are mediated by inhibiting XO-mediated intracellular ROS production. Taken together, our data suggest that XO mediates LPS-induced phosphorylation of JNK through ROS production and MKP-1 inactivation, leading to MCP-1 production in macrophages. These studies may bring new insights into the novel role of XO in regulating inflammatory process through MAPK phosphatase, and demonstrate the potential use of XO inhibitor in modulating the inflammatory processes.


Conflict of interest statement

Competing Interests: Authors Johji Nomura, Syunsuke Tsujimoto, Mizuho Tamura and Yoshihiro Yamanaka are employees at Teijin Pharma Limited. This does not alter the authors' adherence to all the PLOS ONE policies on sharing data and materials.

Figures

Figure 1
Figure 1. Febuxostat inhibits LPS-induced XO activity and intracellular ROS formation in PMA-treated THP-1 cells.
(A) PMA-treated THP-1 cells were stimulated for the indicated time with 100 ng/mL LPS in the absence or presence of 30 µM febuxostat. The cell homogenates were incubated with 5 µM pterine for 60 min, and fluorescence intensity was measured. Data are shown as mean (n=3). (B) PMA-treated THP-1 cells were loaded for 30 min with 5 µM H 2DCFDA, and then stimulated for the indicated times with 100 ng/mL LPS in the absence or presence of febuxostat (30 µM) or NAC (10 mM). Fluorescence intensity was measured. Data of one representative experiment (out of three experiments) are shown as mean±SEM (n=4). $ P<0.01, # P<0.001 versus control-group, ** P<0.001 versus vehicle/LPS-treated group. (C) Cells were loaded for 30 min with 5 µM H2DCFDA, and then stimulated for 60 min with 100 ng/mL LPS in the absence or presence of febuxostat (0.03, 0.1, 0.3, 1, 3, 10 and 30 µM) or NAC (10 mM). Fluorescence was measured and expressed as fluorescence intensity over LPS-untreated group. Data of one representative (out of three experiments) are shown as mean±SEM (n=4). # P<0.001 versus control-group, ** P<0.01 versus vehicle/LPS-treated group.
Figure 2
Figure 2. Febuxostat suppresses LPS-induced MCP-1 production by inhibiting XO-derived ROS formation in macrophages and mice.
PMA-treated THP-1 cells were incubated for 20 h with 100 ng/mL LPS in the absence or presence of febuxostat or NAC. (A) The levels of MCP-1 in the supernatants were measured by ELISA. Data are shown as mean±SEM (n=4) of four independent experiments performed. # P<0.001 versus control-group, ** P<0.01 versus vehicle/LPS-treated group. (B) Cytotoxicity was determined using WST-8. Data are shown as mean±SEM (n=3) of three independent experiments performed. ns, not significant versus vehicle/LPS-treated group. (C) PMA-treated THP-1 cells were transfected with 50 or 100 nM of XO siRNA or control siRNA, and then incubated for 20 h with 100 ng/mL LPS. The levels of MCP-1 in the supernatants were measured by ELISA. Data of one representative experiment (out of two experiments) are shown as mean±SEM (n=3). # P<0.01 versus 0 nM XO siRNA/control-group, ** P<0.01 versus 0 nM XO siRNA/LPS-treated group. (D) Mice were intraperitoneally treated with 0.5 mL of vehicle (0.6% DMSO) or febuxostat (1 mM), and then injected with 300 µg of LPS. After 6 h, peritoneal lavage and serum were collected. The levels of MCP-1 in peritoneal lavage and serum were measured by ELISA. Data are shown as mean±SEM. LPS-treated mice with vehicle: n=20, with febuxostat: n=18, control mice with vehicle: n=4, and febuxostat: n=4. Value in parentheses indicates mean of MCP-1 concentration. ** P<0.01 versus vehicle/LPS-treated group.
Figure 3
Figure 3. Febuxostat suppresses LPS-induced MCP-1 mRNA expression without affecting mRNA stability.
(A) PMA-treated THP-1 cells were stimulated with 100 ng/mL of LPS for 0, 4 and 16 h in the absence or presence of febuxostat (3, 10 and 30 µM) or NAC (10 mM). Total RNA was extracted, and qRT-PCR was performed as described in materials and methods. Data are shown as mean of two independent experiments in which similar results were obtained. (B) Cells were stimulated with 100 ng/mL of LPS for 2 h in the absence or presence of febuxostat (3, 10 and 30 µM) or NAC (10 mM). Total RNA was extracted, and qRT-PCR was performed as described in materials and methods. Data are shown as mean±SEM (n=3) of three independent experiments. # P<0.001 versus control-group, ** P<0.01 versus vehicle/LPS-treated group. (C) PMA-treated THP-1 cells were stimulated for 4 h with 100 ng/mL LPS in the absence or presence of febuxostat (30 µM), and then treated with 5 µg/mL Actinomycin D (ActD). Two or 4 h after ActD treatment, total RNA was extracted, and qRT-PCR was performed. Data are shown as mean±SEM (n=3) of three independent experiments.
Figure 4
Figure 4. Febuxostat suppresses LPS-induced ROS formation and MCP-1 production more effectively than allopurinol and oxypurinol.
(A) ROS was produced by buttermilk XO (10 mU/mL) and xanthine (100 µM) in the absence or presence of febuxostat (Feb, 100 nM), allopurinol (Allo, 100 µM) or oxypurinol (Oxy, 100 µM), and detected by DCF ROS indicator. Fluorescence was measured. Data are shown as mean±SEM (n=3) of three independent experiments. # P<0.0001 versus control-group,*** P<0.001 versus vehicle-treated group. (B) PMA-treated THP-1 cells were loaded for 30 min with 5 µM H2DCFDA, and then stimulated for 60 min with 100 ng/mL of LPS in the absence or presence of febuxostat (30 µM), allopurinol (300 µM) oroxypurinol (300 µM). Fluorescence was measured and expressed as fluorescence intensity over LPS-untreated group. Data of one representative experiment (out of three experiments) are shown as means ± SEM (n=4). # P<0.001 versus control-group, ** P<0.01 versus vehicle/LPS-treated group. (C) PMA-treated THP-1 cells were incubated for 20 h with 100 ng/mL of LPS in the absence or presence of febuxostat (30 µM), allopurinol (300 µM) or oxypurinol (300 µM). The levels of MCP-1 in the supernatants were measured by ELISA. Data of one representative experiment (out of three experiments) are shown as mean±SEM (n=3). # P<0.001 versus control-group, * P<0.05, *** P<0.001 versus vehicle/LPS-treated group. (D) Cells were stimulated for 16 h with 100 ng/mL of LPS in the absence or presence of febuxostat (30 µM), allopurinol (300 µM) or oxypurinol (300 µM). Total RNA was extracted, and qRT-PCR was performed as described in materials and methods. Data are shown as mean±SEM (n=3) of three independent experiments. ** P<0.01, *** P<0.001 versus vehicle/LPS-treated group.
Figure 5
Figure 5. Febuxostat suppresses LPS-induced activation of JNK.
Cells were stimulated with 100 ng/mL LPS in the presence or absence of febuxostat (30 µM). (A) Western blot analysis using anti-total IκBα, phospho-p38 and phospho-JNK antibodies. Equal amounts of proteins were loaded. The results are representative of two independent experiments in which similar results were obtained. (B) PMA-treated THP-1 cells were stimulated for 20 h with 100 ng/mL LPS in the presence or absence of SP600125 (0.3, 3 and 30 µM). The levels of MCP-1 in the supernatants were measured by ELISA. Data of one representative (out of three experiments) are shown as mean±SEM (n=3). # P<0.001 versus control-group, ** P<0.01 versus vehicle/LPS-treated group. (C) Total RNA was extracted, and qRT-PCR was performed as described in materials and methods. Data are shown as mean±SEM (n=3) of three independent experiments. # P<0.001 versus control-group, * P<0.05, *** P<0.001 versus vehicle/LPS-treated group.
Figure 6
Figure 6. Febuxostat suppresses LPS-induced MCP-1 production via MKP-1-dependent inhibition of JNK through increasing MKP-1 activity.
Cells incubated for 30 min with vanadate (200 µM) or Ro-31-8220 (1 µM) were pretreated for 10 min with febuxostat (30 µM) or NAC (10 mM), and then stimulated for 1 (A) or 2 h (B) with 100 ng/mL LPS. (A) Western blot analysis using anti-phospho-JNK and β-actin antibodies. Equal amounts of proteins were loaded. The results are representative of two independent experiments in which similar results were obtained. (B) Total RNA was extracted, and qRT-PCR was performed as described in materials and methods. Data are shown as mean±SEM (n=3) of three independent experiments. $ P<0.01, # P<0.001 versus control-group, * P<0.05, *** P<0.001 versus vehicle/LPS-treated group. (C) Cells were stimulated with 100 ng/mL of LPS in the presence or absence of febuxostat (30 µM). MKP-1 activities in immunoprecipitates were measured. Data are shown as mean±SEM (n=3) of three independent experiments. * P<0.05, *** P<0.001 versus vehicle-treated group. (D) Schema of the signaling pathways involved in XO-mediated induction of MCP-1 expression by LPS. As indicated, LPS up-regulates MCP-1 expression via JNK-dependent pathway. XO activated by LPS causes decreased MKP-1 activity via accumulation of intracellular ROS that, in turn, leads to enhancement of JNK phosphorylation, the positive regulator of MCP-1 expression. Febuxostat suppresses LPS-induced MCP-1 expression through inhibiting XO/ROS/MKP-1/JNK pathway.

References

    1. Park JG, Oh GT (2011) The role of peroxidases in the pathogenesis of atherosclerosis. BMB Rep 44: 497-505. doi:10.5483/BMBRep.2011.44.8.497. PubMed: 21871172. - DOI - PubMed
    1. Filippin LI, Vercelino R, Marroni NP, Xavier RM (2008) Redox signalling and the inflammatory response in rheumatoid arthritis. Clin Exp Immunol 152: 415-422. doi:10.1111/j.1365-2249.2008.03634.x. PubMed: 18422737. - DOI - PMC - PubMed
    1. Comhair SA, Erzurum SC (2002) Antioxidant responses to oxidant-mediated lung diseases. Am J Physiol Lung Cell Mol Physiol 283: L246-L255. PubMed: 12114185. - PubMed
    1. Cape JL, Hurst JK (2009) The role of nitrite ion in phagocyte function--perspectives and puzzles. Arch Biochem Biophys 484: 190-196. doi:10.1016/j.abb.2009.01.010. PubMed: 19402211. - DOI - PMC - PubMed
    1. Berry CE, Hare JM (2004) Xanthine oxidoreductase and cardiovascular disease: molecular mechanisms and pathophysiological implications. J Physiol 555: 589-606. doi:10.1113/jphysiol.2003.055913. PubMed: 14694147. - DOI - PMC - PubMed

Publication types

MeSH terms