. 2013 Sep 27;8(9):e76075.
doi: 10.1371/journal.pone.0076075. eCollection 2013.

AAV-mediated, optogenetic ablation of Müller Glia leads to structural and functional changes in the mouse retina

Affiliations

AAV-mediated, optogenetic ablation of Müller Glia leads to structural and functional changes in the mouse retina

Leah C Byrne et al. PLoS One. .

Abstract

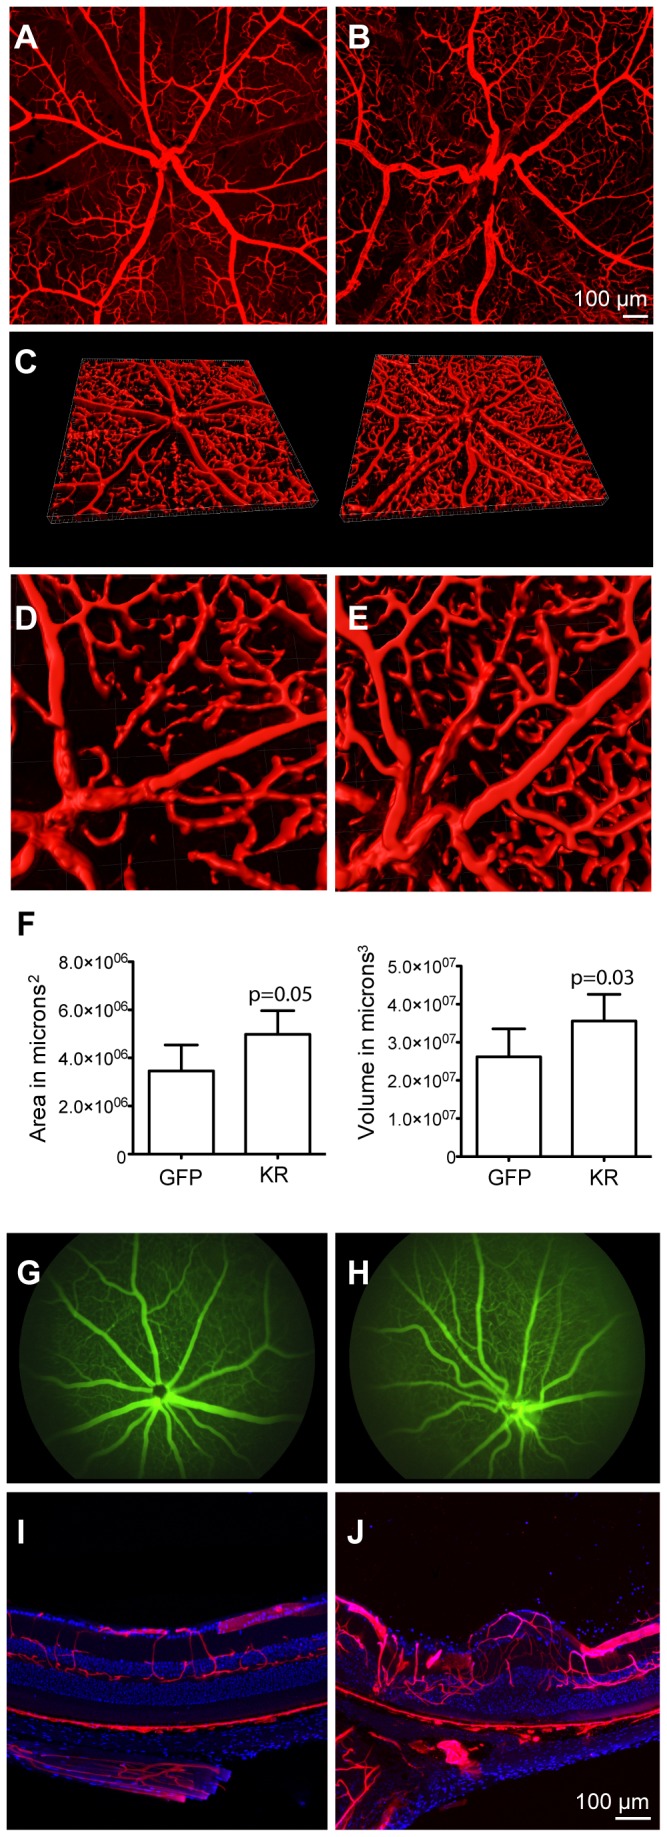
Müller glia, the primary glial cell in the retina, provide structural and metabolic support for neurons and are essential for retinal integrity. Müller cells are closely involved in many retinal degenerative diseases, including macular telangiectasia type 2, in which impairment of central vision may be linked to a primary defect in Müller glia. Here, we used an engineered, Müller-specific variant of AAV, called ShH10, to deliver a photo-inducibly toxic protein, KillerRed, to Müller cells in the mouse retina. We characterized the results of specific ablation of these cells on visual function and retinal structure. ShH10-KillerRed expression was obtained following intravitreal injection and eyes were then irradiated with green light to induce toxicity. Induction of KillerRed led to loss of Müller cells and a concomitant decrease of Müller cell markers glutamine synthetase and cellular retinaldehyde-binding protein, reduction of rhodopsin and cone opsin, and upregulation of glial fibrillary acidic protein. Loss of Müller cells also resulted in retinal disorganization, including thinning of the outer nuclear layer and the photoreceptor inner and outer segments. High resolution imaging of thin sections revealed displacement of photoreceptors from the ONL, formation of rosette-like structures and the presence of phagocytic cells. Furthermore, Müller cell ablation resulted in increased area and volume of retinal blood vessels, as well as the formation of tortuous blood vessels and vascular leakage. Electrophysiologic measures demonstrated reduced retinal function, evident in decreased photopic and scotopic electroretinogram amplitudes. These results show that loss of Müller cells can cause progressive retinal degenerative disease, and suggest that AAV delivery of an inducibly toxic protein in Müller cells may be useful to create large animal models of retinal dystrophies.


Conflict of interest statement

Competing Interests: The authors have the following interests. David Schaffer and John Flannery are patent-holders on the use of ShH10 in the retina (patent, Adeno-associated virus virions with variant capsid and methods of use thereof, US20120164106). Kenneth P. Greenberg is employed by Spiral Devices, LLC. There are no further patents, products in development or marketed products to declare. This does not alter the authors' adherence to all the PLOS ONE policies on sharing data and materials, as detailed online in the guide for authors.

Figures

Figure 1
Figure 1. Light activated toxicity of KillerRed.
An in vitro assay was performed to test the toxicity of KillerRed after exposure to a 1000 lux 540-580 nm LED light source. 293T cells transfected to express GFP showed no change after exposure to 40 minutes of green light, while cells transfected with KillerRed had abnormal morphology after 5 minutes and were necrotic by 20 minutes. After 40 minutes of light exposure, cells expressing KillerRed were eliminated. Scale bar = 50 microns.
Figure 2
Figure 2. Experimental design.
A) cDNA encoding KillerRed was packaged in the AAV variant ShH10, which infects Müller glia specifically. A ubiquitous CAG promoter was used to drive expression of the protein. B) ShH10-KillerRed (or ShH10-GFP in the contralateral control eye) was injected into the vitreous cavity of mouse eyes, leading to expression of KillerRed in Müller glia across the retina. C) Mice were exposed to 540-580 nm light. The KillerRed protein, which contains a membrane localization signal, dimerizes in response to green light and releases reactive oxygen species, leading to necrosis of Müller glia expressing the protein, presumably through lipid oxidation. D) A flatmount of ShH10-scCAG-GFP-injected retina, ganglion cell side up, shows that intravitreal injection of the ShH10 variant led to high levels of transgene expression across the retina. E) A high resolution image a retinal flatmount injected with ShH10-GFP shows high levels of expression in Müller cells in close proximity to blood vessels. F) A cross-section of a retina injected with ShH10-GFP shows large numbers of GFP-expressing Müller glia. G-I) ShH10-GFP and GS colocalization. ShH10-GFP injected eyes (G) labeled with anti-GS antibodies in red (H) show colocalization of GFP and GS in Müller glia in yellow (I). J) Montage of 10X images of a retina from a mouse injected with ShH10-KR and raised in the dark shows panretinal expression of KillerRed protein one month after injection. Inset depicts a higher resolution image of the boxed portion of the retina. Blue labeling is DAPI stained nuclei.
Figure 3
Figure 3. Immunohistochemical analysis of KillerRed-injected eyes.
Cross-sections of agarose-embedded eyecups from animals injected with KillerRed, or contralateral control eyes injected with GFP, were harvested 3 months after illumination and labeled with antibodies against GS, GFAP, laminin, M-opsin, or PNA. DAPI, in blue, labels cell nuclei. Top row: ShH10-KillerRed-injected retinas were disorganized and had reduced anti-GS labeling. The arrow indicates an area with absence of GS labeling, and a corresponding displacement of photoreceptor cell bodies from the ONL into the subretinal space. Second row: KillerRed injected eyes had increased levels of GFAP labeling, indicating GFAP upregulation. Third row: KillerRed-injected eyes showed disorganized laminin labeling. Arrow indicates a region where laminin penetrates into the retina, near a region of disorganization of retinal layers. Fourth row: anti-cone opsin labeling shows that Killer-Red injected eyes have shortened outer segments and mislocalized opsin labeling in the axon and cone pedicle. Cone opsin labeling is absent in the area where cell bodies have penetrated into the subretinal space. Bottom row: PNA labeling shows reduced density of cones near the optic nerve head in Killer-Red injected eyes. Scale bar is 50 microns.
Figure 4
Figure 4. Histology of KillerRed injected eyes.
A) SD-OCT imaging reveals structural abnormalities in KillerRed-injected eyes, including disorganization of retinal layers, areas of hyper-reflectivity, and retinal thinning 3 months after injection. Red arrows point to diffuse, hyperreflective regions lying between the ONL and IS/OS junction. White arrows indicate areas where retinal layers have become disorganized. White arrowheads show dense hyperreflective spots that may be macrophages in the vitreous. B) Resin-embedded thin sectioning from eyes harvested 4 months after illumination shows that KillerRed-injected eyes were characterized by a loss of retinal organization, the presence of invading cells, apparent near blood vessels, formation of rosettes, and phagocytic cells. C) Thin sections corroborate the structural changes observed by anti-GS labeling and confocal imaging. Arrows indicate absence of GS labeling coinciding with mislocalization of photoreceptor soma into the subretinal space. D) Thin sectioning shows the presence of rosette structures, which were also observed with in vivo OCT imaging.
Figure 5
Figure 5. Structural changes following Müller cell ablation.
A) OCT imaging collected over the course of 8 weeks reveals the progression of structural changes following a single 2 hour irradiation. Blurring of the IS/OS was visible 1.5 days after irradiation (red arrows). Disorganization of the ONL was visible 2 weeks after ablation (yellow arrows). Inner retinal changes were apparent 8 weeks after irradiation (blue arrows). B) Quantification of thickness of retinal layers from OCT images performed 5 months after irradiation (n=5) revealed that the overall thickness of the retina was only slightly (but not significantly) decreased. In contrast, a decrease in the thickness of photoreceptor inner and outer segments was significant, as was a decrease in the thickness of the ONL (*=P<0.05).
Figure 6
Figure 6. qRT-PCR analysis of mRNA levels.
Quantitative RT-PCR performed on mRNA harvested from KillerRed and GFP-injected eyes, three months after irradiation, revealed that levels of GS (64% of WT), CRALBP (65%), Rhodopsin (76%), and GNAT2 (82%) were reduced in KillerRed-injected eyes compared to GFP-injected eyes or WT eyes. Levels of GFAP (205% of WT) increased, while levels of VEGF (98%) were equal to WT at the time point measured. A one-way ANOVA with a Tukey multiple comparison test was used to determine significance (*=P<0.05; ** = P<0.01).
Figure 7
Figure 7. Effect of KillerRed expression on retinal vasculature.
Changes in retinal blood vessels five months after irradiation were visualized in animals perfused with DiI, a lipophilic fluorescent dye that labeled endothelial cells. A) Flatmounted retina from an ShH10-GFP-injected eye, labeled with DiI. B) DiI labeled, ShH10-KillerRed injected retinal flatmount showing disorganized retinal vasculature and increasing tortuosity of blood vessels. C) 3D reconstruction, created with a confocal microscope and Imaris software, of DiI labeled retinal vasculature (left eye: GFP-injected retinal flatmount, right image: KillerRed-injected). D-E) High resolution image near the optic nerve head showing 3D reconstruction of DiI labeled blood vessels in GFP (D) or KillerRed (E) injected eyes. F) Quantification of the area and volume of retinal vasculature in DiI labeled retinal flatmounts. Killer-Red injected retinas had increased area and volume of retinal blood vessels compared to contralateral GFP-injected eyes. G-H) Fundus imaging following fluorescein injections. WT eyes have normal retinal blood vessels without leakage (G) while KillerRed-injected eyes (H) have leakage near the optic nerve head. I-J) Cross-sections through DiI labeled retinas. GFP-injected eyes show normal organization of retinal and choroidal blood vessels (I) while KillerRed-injected eyes (J) have disorganized retinal blood vessels. No significant changes in the choroidal blood supply were noted.
Figure 8
Figure 8. Electroretinogram recordings.
A) Graph of the amplitude of scotopic, full field a-waves in response to flashes of increasing intensity, recorded 4 months after irradiation. A-wave amplitudes were reduced in KillerRed-injected eyes. The reduction in a-wave amplitude was statistically significant, though only at the highest light intensity tested. P-values from a 2-tailed paired Student’s t-test are indicated above the graph for each light intensity. B) Graph of the amplitude of scotopic (upper traces) and photopic (lower traces) full field b-waves in response to flashes of increasing intensity. B-wave amplitudes were significantly decreased in KillerRed injected eyes for every light intensity under both photopic and scotopic conditions. C) Representative ERG traces from ShH10-GFP and ShH10-KillerRed injected eyes under scotopic (upper sets of traces) and photopic (lower sets) conditions. D) ERG recordings made under rod-specific conditions (0.01 log cd x s/m2), rod and cone mixed signal conditions (1 log cd x s/m2), or light adapted cone-mediated conditions (10 log cd x s/m2) were recorded over the course of 8 weeks. This time course of functional loss revealed that the rod-driven signal was significantly reduced 1 week after irradiation. Similarly, under mesopic conditions, a decrease was observed one week after irradiation. The photopic, light-adapted ERG was decreased 2 weeks after Müller cell ablation.

References

    1. Tout S, Chan-Ling T, Holländer H, Stone J (1993) The role of Müller cells in the formation of the blood-retinal barrier. Neuroscience 55: 291–301. doi:10.1016/0306-4522(93)90473-S. PubMed: 8350991. - DOI - PubMed
    1. Nishikiori N, Osanai M, Chiba H, Kojima T, Mitamura Y et al. (2007) Glial cell-derived cytokines attenuate the breakdown of vascular integrity in diabetic retinopathy. Diabetes 56: 1333–1340. doi:10.2337/db06-1431. PubMed: 17470563. - DOI - PubMed
    1. Reichenbach AA, Bringmann AA (2013) New functions of Müller cells. Glia 61: 651–678. doi:10.1002/glia.22477. PubMed: 23440929. - DOI - PubMed
    1. Bringmann A, Pannicke T, Grosche J, Francke M, Wiedemann P et al. (2006) Müller cells in the healthy and diseased retina. Prog Retin Eye Res 25: 397–424. doi:10.1016/j.preteyeres.2006.05.003. PubMed: 16839797. - DOI - PubMed
    1. Powner MB, Gillies MC, Tretiach M, Scott A, Guymer RH et al. (2010) Perifoveal Müller Cell Depletion in a Case of Macular Telangiectasia Type 2. Ophthalmology 117: 2407–2416. doi:10.1016/j.ophtha.2010.04.001. PubMed: 20678804. - DOI - PMC - PubMed

Publication types

MeSH terms