. 2013 Sep 27;8(9):e76106.
doi: 10.1371/journal.pone.0076106. eCollection 2013.

Ginger extract inhibits biofilm formation by Pseudomonas aeruginosa PA14

Affiliations

Ginger extract inhibits biofilm formation by Pseudomonas aeruginosa PA14

Han-Shin Kim et al. PLoS One. .

Abstract

Bacterial biofilm formation can cause serious problems in clinical and industrial settings, which drives the development or screening of biofilm inhibitors. Some biofilm inhibitors have been screened from natural products or modified from natural compounds. Ginger has been used as a medicinal herb to treat infectious diseases for thousands of years, which leads to the hypothesis that it may contain chemicals inhibiting biofilm formation. To test this hypothesis, we evaluated ginger's ability to inhibit Pseudomonas aeruginosa PA14 biofilm formation. A static biofilm assay demonstrated that biofilm development was reduced by 39-56% when ginger extract was added to the culture. In addition, various phenotypes were altered after ginger addition of PA14. Ginger extract decreased production of extracellular polymeric substances. This finding was confirmed by chemical analysis and confocal laser scanning microscopy. Furthermore, ginger extract formed noticeably less rugose colonies on agar plates containing Congo red and facilitated swarming motility on soft agar plates. The inhibition of biofilm formation and the altered phenotypes appear to be linked to a reduced level of a second messenger, bis-(3'-5')-cyclic dimeric guanosine monophosphate. Importantly, ginger extract inhibited biofilm formation in both Gram-positive and Gram-negative bacteria. Also, surface biofilm cells formed with ginger extract detached more easily with surfactant than did those without ginger extract. Taken together, these findings provide a foundation for the possible discovery of a broad spectrum biofilm inhibitor.


Conflict of interest statement

Competing Interests: The authors have declared that no competing interests exist.

Figures

Figure 1
Figure 1. Growth curves of PA14 with 1% and 10% ginger extract.
Growth curve was plotted with the control (i.e., no ginger extract addition). The growth was traced by measuring OD at 595 nm hourly for 14 h. Error bars indicate the standard deviations of 3 measurements.
Figure 2
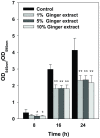
Figure 2. Quantification of PA14 biofilm formed in the wells of microtiter plates for cultures with various quantities of ginger extract (0, 1, 5, and 10%).
The biofilm was quantified at 8, 16, and 24 h of incubation by dividing OD at 545 nm by OD at 595 nm for cells stained with crystal violet. Error bars indicate the standard deviations of 6 measurements. *, P < 0.05 versus the control. **, P < 0.00001 versus the control.
Figure 3
Figure 3. Comparison of EPS constituents of planktonic and biofilm cells with 1% ginger extract and without.
(A) Total protein in EPS of PA14 cultures. (B) Total carbohydrates in EPS of PA14 cultures. Error bars indicate the standard deviations of 7 measurements. **, P < 0.001 versus the control. *, P < 0.01 versus the control.
Figure 4
Figure 4. Confocal laser scanning microscope analyses.
(A) Images of PA14 biofilms formed with (right) 1% ginger extract and without (left). The top images were obtained by combining DAPI, ConA, and Ruby images. The middle images are DAPI, whereas the bottom images are the combination of ConA and Ruby. The fluorescent colors generated from DAPI, ConA, and Ruby were blue, green, and red, respectively. The fluorescent color generated from the combinations of DAPI, ConA, and Ruby was cyan, while that of ConA and Ruby was yellow. (B) Relative ConA and Ruby intensities normalized by DAPI intensity for PA14 biofilms with 1% ginger extract and without. *, P < 0.01 versus the control.
Figure 5
Figure 5. Comparison of colony morphology on Congo red agar plates.
(A) Colony of PA14 grown without ginger extract. (B) Colony of PA14 grown with 1% ginger extract.
Figure 6
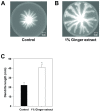
Figure 6. Comparison of swarming motility on swarm agar plates.
(A) PA14 cells grown without ginger extract. (B) PA14 cells grown with 1% ginger extract. (C) Length of dendrites of PA14 cells grown with 1% ginger extract and without. *, P < 0.00001 versus the control.
Figure 7
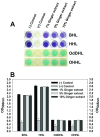
Figure 7. QS inhibition assay for ginger extract.
QS inhibition related to BHL and HHL was assayed using CV026, whereas that related to OdDHL and OHHL was assayed using NT1. (A) Color changes of CV026 or NT1 cultures with various concentrations of ginger extract (0, 1, 5, and 10%), various AHLs (BHL, HHL, OdDHL, and OHHL) and 2(5H)-furanone (positive control) (B) Color change was measured with OD at 545 nm for NT1 cultures and with OD at 590nm for CV026 cultures, respectively. *, P < 0.0001 versus the control.
Figure 8
Figure 8. SDS detachment of PA14 biofilm formed with 1% ginger extract and without.
The biofilm in the wells of microtiter plates was quantified by dividing OD at 545 nm by OD at 595 nm for cells stained with crystal violet. Error bars indicate the standard deviations of 4 measurements. *, P < 0.01 versus the control, **, P < 0.00001 versus the control.
Figure 9
Figure 9. Concentration of c-di-GMP of planktonic and biofilm cells grown with 1% ginger extract and without.
Error bars indicate the standard deviations of 3 measurements. *, P<0.001 versus the control. Actual mass peaks are shown in Figure S3.
Figure 10
Figure 10. The effects of ginger extract on E. coli, S. aureus, and B. megaterium.
(A) Biofilm formation in the wells of microtiter plates for cultures with various concentrations of ginger extract (0, 1, 5, and 10%). The biofilm in the wells of the microtiter plate were quantified at 24 h of incubation by dividing OD at 545 nm by OD at 595 nm for cells stained with crystal violet. Error bars indicate the standard deviations of 15 measurements. *, P < 0.00001 versus the control. (B) Growth curves with 1% and 10% ginger extract. Growth curve was plotted with the control (i.e., no ginger extract addition). The growth was traced by measuring OD at 595 nm hourly for 14 h. Error bars indicate the standard deviations of three measurements.

References

    1. Hall-Stoodley L, Costerton JW, Stoodley P (2004) Bacterial biofilms: from the natural environment to infectious diseases. Nat Rev Microbiol 2: 95-108. doi:10.1038/nrmicro821. PubMed: 15040259. - DOI - PubMed
    1. Mayer C, Moritz R, Kirschner C, Borchard W, Maibaum R et al. (1999) The role of intermolecular interactions: studies on model systems for bacterial biofilms. Int J Biol Macromol 26: 3-16. doi:10.1016/S0141-8130(99)00057-4. PubMed: 10520951. - DOI - PubMed
    1. Flemming HC, Neu TR, Wozniak DJ (2007) The EPS matrix: the "house of biofilm cells". J Bacteriol 189: 7945-7947. doi:10.1128/JB.00858-07. PubMed: 17675377. - DOI - PMC - PubMed
    1. Prosser BL, Taylor D, Dix BA, Cleeland R (1987) Method of evaluating effects of antibiotics on bacterial biofilm. Antimicrob Agents Chemother 31: 1502-1506. doi:10.1128/AAC.31.10.1502. PubMed: 3435100. - DOI - PMC - PubMed
    1. Nickel JC, Ruseska I, Wright JB, Costerton JW (1985) Tobramycin resistance of Pseudomonas aeruginosa cells growing as a biofilm on urinary catheter material. Antimicrob Agents Chemother 27: 619-624. doi:10.1128/AAC.27.4.619. PubMed: 3923925. - DOI - PMC - PubMed

Publication types

MeSH terms

LinkOut - more resources