

Trophic hierarchies illuminated via amino acid isotopic analysis
- PMID: 24086703
- PMCID: PMC3783375
- DOI: 10.1371/journal.pone.0076152
Trophic hierarchies illuminated via amino acid isotopic analysis
Abstract
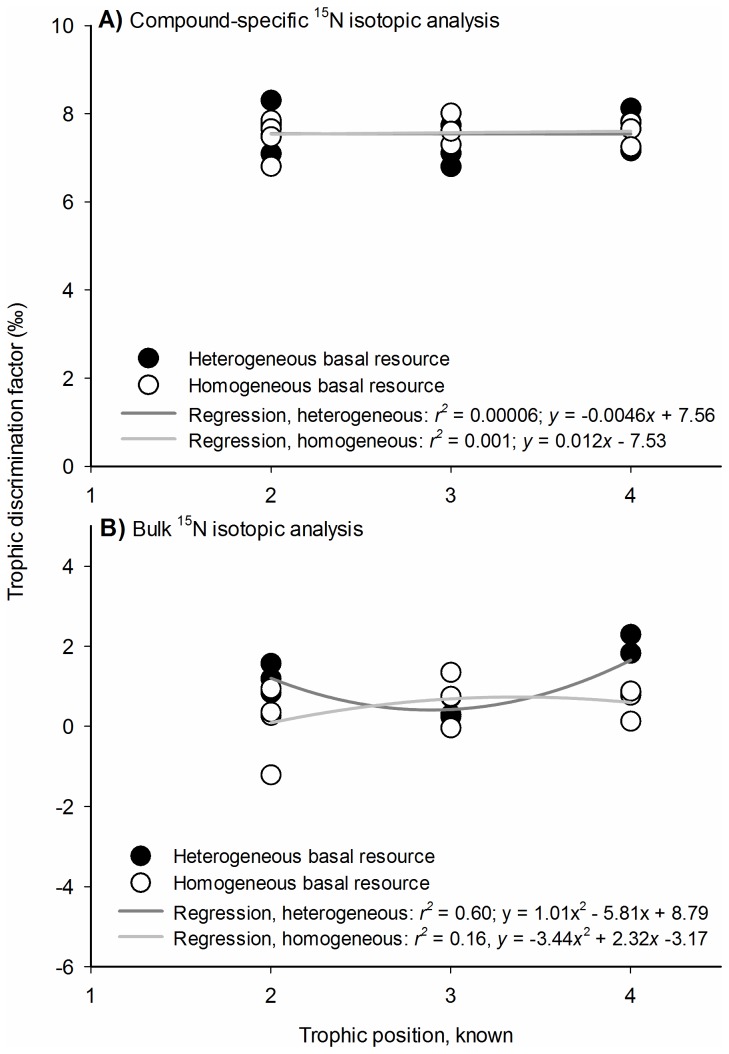
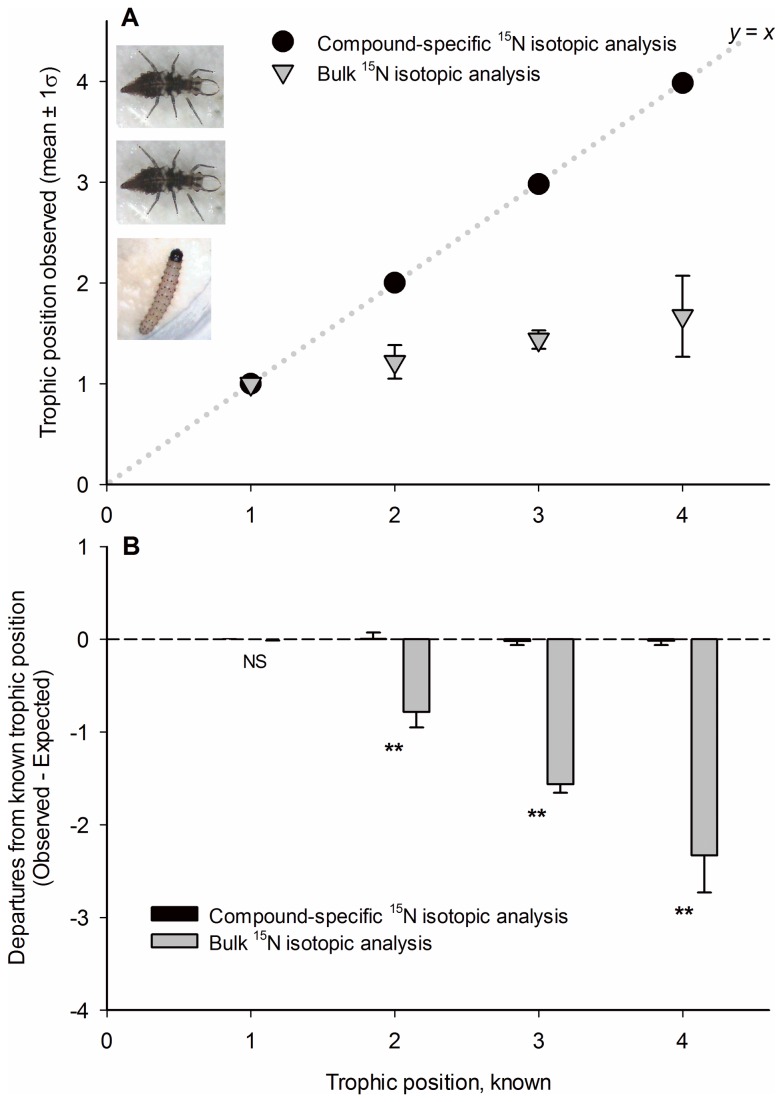
Food web ecologists have long sought to characterize the trophic niches of animals using stable isotopic analysis. However, distilling trophic position from isotopic composition has been difficult, largely because of the variability associated with trophic discrimination factors (inter-trophic isotopic fractionation and routing). We circumvented much of this variability using compound-specific isotopic analysis (CSIA). We examined the (15)N signatures of amino acids extracted from organisms reared in pure culture at four discrete trophic levels, across two model communities. We calculated the degree of enrichment at each trophic level and found there was a consistent trophic discrimination factor (~7.6‰). The constancy of the CSIA-derived discrimination factor permitted unprecedented accuracy in the measurement of animal trophic position. Conversely, trophic position estimates generated via bulk-(15)N analysis significantly underestimated trophic position, particularly among higher-order consumers. We then examined the trophic hierarchy of a free-roaming arthropod community, revealing the highest trophic position (5.07) and longest food chain ever reported using CSIA. High accuracy in trophic position estimation brings trophic function into sharper focus, providing greater resolution to the analysis of food webs.
Conflict of interest statement
Figures

References
-
- Gannes LZ, O’Brien DM, Martínez del Rio C (1997) Stable Isotopes in Animal Ecology: Assumptions, Caveats, and a Call for More Laboratory Experiments. Ecology 78: 1271–1276. doi:10.1890/0012-9658(1997)078[1271:SIIAEA]2.0.CO;2. - DOI
-
- Newsome SD, Martínez del Rio C, Bearhop S, Phillips DL (2007) A niche for isotopic ecology. Front Ecol Environ 5: 429–436. doi:10.1890/1540-9295(2007)5[429:ANFIE]2.0.CO;2. - DOI
-
- DeNiro MJ, Epstein S (1981) Influence of diet on the distribution of nitrogen isotopes in animals. Geochim Cosmochim Acta 45: 341–351. doi:10.1016/0016-7037(81)90244-1. - DOI
-
- Minagawa M, Wada E (1984) Stepwise enrichment of 15N along food chains: Further evidence and the relation between δ15N and animal age. Geochim Cosmochim Acta 48: 1135–1140. doi:10.1016/0016-7037(84)90204-7. - DOI
-
- Peterson BJB, Fry B (1987) Stable isotopes in ecosystem studies. Annu Rev Ecol Syst 18: 293–320. doi:10.1146/annurev.es.18.110187.001453. - DOI
Publication types
MeSH terms
Substances
LinkOut - more resources
Full Text Sources
Other Literature Sources
Molecular Biology Databases
