. 2013 Sep 27;8(9):e76310.
doi: 10.1371/journal.pone.0076310. eCollection 2013.

Analysis of transduction efficiency, tropism and axonal transport of AAV serotypes 1, 2, 5, 6, 8 and 9 in the mouse brain

Affiliations

Analysis of transduction efficiency, tropism and axonal transport of AAV serotypes 1, 2, 5, 6, 8 and 9 in the mouse brain

Dominik F Aschauer et al. PLoS One. .

Abstract

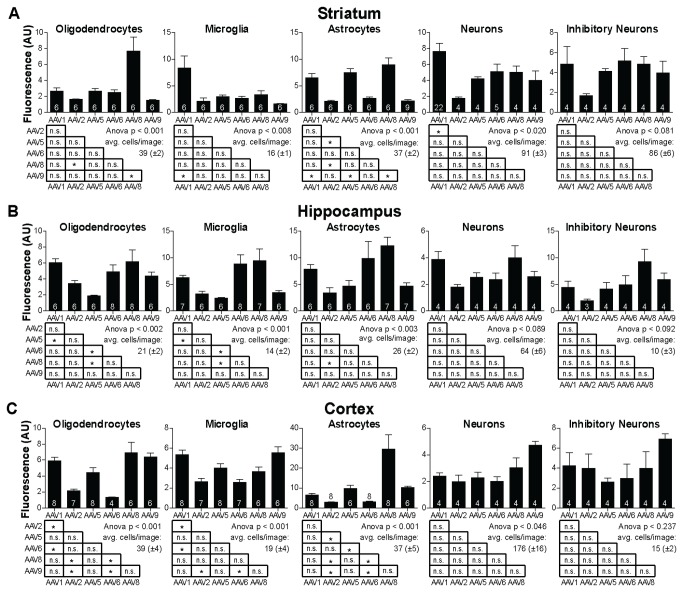
Recombinant Adeno-associated virus vectors (rAAV) are widely used for gene delivery and multiple naturally occurring serotypes have been harnessed to target cells in different tissues and organs including the brain. Here, we provide a detailed and quantitative analysis of the transduction profiles of rAAV vectors based on six of the most commonly used serotypes (AAV1, AAV2, AAV5, AAV6, AAV8, AAV9) that allows systematic comparison and selection of the optimal vector for a specific application. In our studies we observed marked differences among serotypes in the efficiency to transduce three different brain regions namely the striatum, hippocampus and neocortex of the mouse. Despite the fact that the analyzed serotypes have the general ability to transduce all major cell types in the brain (neurons, microglia, astrocytes and oligodendrocytes), the expression level of a reporter gene driven from a ubiquitous promoter varies significantly for specific cell type / serotype combinations. For example, rAAV8 is particularly efficient to drive transgene expression in astrocytes while rAAV9 appears well suited for the transduction of cortical neurons. Interestingly, we demonstrate selective retrograde transport of rAAV5 along axons projecting from the ventral part of the entorhinal cortex to the dentate gyrus. Furthermore, we show that self-complementing rAAV can be used to significantly decrease the time required for the onset of transgene expression in the mouse brain.


Conflict of interest statement

Competing Interests: SK is an employee of Boehringer Ingelheim Pharma GmbH & Co. KG, which partly funded this study. There are no patents, products in development or marketed products to declare. This does not alter the authors' adherence to all the PLOS ONE policies on sharing data and materials.

Figures

Figure 1
Figure 1. General expression efficacy in striatum, hippocampus and auditory cortex.
A) Left: six confocal fluorescence images of the striatum taken from mice injected with various AAV serotypes as indicated in the panels. Blue: DAPI, green: GFP. Right, top: schematic of a coronal brain section with red box indicating the position of the images shown on the left with reference to Bregma. Right, bottom: Mean fluorescence index (see methods) for the striatal sections measured following transduction with the different serotypes. Number of analyzed mice shown at the bottom of the bars. B) Same as A), however, showing images and data from mice that received injections in the hippocampus. C) Same as A), however, showing images and data from mice that received injections in the auditory cortex. Acquisition and display settings for images from a given brain area are the same for different serotypes. All scale bars: 500 µm. All bars represent mean±SEM. Asterisks indicate significant differences at the p<0.05 level.
Figure 2
Figure 2. Expression efficacy in immunohistochemically identified cell-types.
A) Confocal images of brain sections of the hippocampus prepared from mice that received injections of rAAV5 (left) and rAAV8 (right). Red channel: immunohistochemical label for GFAP, an astrocyte marker; blue channel: DAPI, labeling nuclei, green channel: GFP expression driven by viral vector. Examples of individual immunohistochemically identified cell bodies are marked with white arrowheads. B) Cumulative distributions of fluorescence measurements from individual cells expressed as ‘fold background’ (see methods). Individual lines correspond to a given analyzed section. Note, that cumulative distributions for astrocytes obtained from rAAV8 transduced mice are systematically shifted towards higher fluorescence levels as compared to rAAV5 transduced mice. C) Confocal images of brain sections of the auditory cortex prepared from mice that received injections of rAAV1 (left) and rAAV9 (right). Red channel: immunohistochemical label for NeuN, a neuron marker; blue channel: DAPI, labeling nuclei, green channel: GFP expression driven by viral vector. Examples of individual immunohistochemically identified cell bodies are marked with white arrowheads. D) Cumulative distributions of fluorescence measurements from individual cortical neurons expressed as fold background. All scale bars: 25 µm.
Figure 3
Figure 3. Summary of cell-type specific expression analysis.
A) Data obtained from striatum: average of the median florescence levels for oligodendrocytes, microglia, astrocytes, neurons and inhibitory neurons for all of the analyzed six serotypes. Number of analyzed sections is shown at the bottom of the bars. Statistical analysis of fluorescence measurements shown below bar graphs. Asterisks indicate significant differences at the p<0.05 level. B) same as A), however, showing data obtained from hippocampal injections. C) same as A), however, showing data obtained from auditory cortex injections. All bars represent mean±SEM.
Figure 4
Figure 4. Density of microglia in transduced areas.
A) Confocal images taken from the ipsilateral (left) and contralateral (right) striatum of mice that received an injection of LPS. Red channel: immunohistochemical label for Iba1, a marker for microglia. Individual cell bodies of microglia are marked with white arrowheads. Note the high number of microglia in the ipsilateral striatum. B) same as A), however, showing images obtained from mice that received an injection of rAAV9 in the striatum. Note, that microglia counts are low in both hemispheres. Scale bars: 10 µm. C) Quantification of ipsilateral and contralateral microglia densities in the striatum of mice with rAAV and LPS injections. Number of analyzed sections is shown at bottom of bars. D) Ipsilateral and contralateral density of microglia in the hippocampus of mice following rAAV injections. E) Ipsilateral and contralateral density of microglia in the auditory cortex of mice following rAAV injections. All bars represent mean±SEM.
Figure 5
Figure 5. rAAV5 injections in the dentate gyrus lead to retrograde labeling of cells in the ventral entorhinal cortex.
A) Confocal images from horizontal brain sections at -3 mm along the dorso-ventral axis in reference to Bregma taken from a mouse that received a co-injection of rAAV5 driving expression of GFP (green) and fluorescently labeled retrograde tracer CTB (red) in the dentate gyrus. B) same as A), for Bregma -4.5 mm. C) same as A), for Bregma -6.0 mm. Double labeled cells in the ventral entorhinal cortex appear yellow. White squares on the left indicate parts of images shown in higher magnification on the right. Scale bars: for whole sections: 1 mm; for insets: 250 µm. D) Cell counts of CTB-only labeled cells (red), GFP-only labeled cells (green) and double positive cells (yellow) in horizontal sections of the ipsilateral entorhinal cortex along the dorso-ventral axis of three individual mice.
Figure 6
Figure 6. Retrogradely labeled cells in the entorhinal cortex are excitatory neurons.
A) Confocal fluorescence images of the same horizontal section of the ventral entorhinal cortex of a mouse that received a co-injection of rAAV5 driving GFP expression (green) and fluorescently labeled CTB (red) that was stained with DAPI (blue) and immunohistochemically labeled against the neuronal marker NeuN (magenta). Examples of individual GFP and CTB-labeled neurons are marked with white arrowheads. The white square denotes the area shown in higher magnification. Scale bars: low magnification: 100 µm, high magnification: 50 µm. B) Quantification of CTB positive cells and GFP positive cells (bars: mean±SEM; CTB: n= 918 cells, 4 sections, one mouse; GFP: n=264 cells, 4 sections, one mouse) with the neuronal marker NeuN showing in both cases almost complete co-labeling. C) Confocal fluorescence images of the same horizontal section of the ventral entorhinal cortex of a transgenic mouse in which GAD2-expressing interneurons are labeled by tdTomato (red) that received an injection of rAAV5 driving GFP expression (green) that was stained with DAPI (blue). Individual interneurons are marked with white arrowheads. The white square denotes the area shown in higher magnification. Scale bars: low magnification: 100 µm and high magnification: 50 µm) D) Quantification of GAD2-expressing interneurons and rAAV5 transduced neurons showing disjunct populations (bars: mean±SEM; n=1033 cells, 4 sections, one mouse).
Figure 7
Figure 7. Time course of expression in striatal neurons transduced in vivo with ssAAV or scAAV.
A) Schematics of the ssAAV and scAAV constructs driving expression of an H2B-GFP fusion protein under the control of the neuronal human Synapsin 1 promoter that have been packaged in AAV8 capsids. B) High-magnification confocal fluorescence image of a coronal striatal section containing scAAV-transduced neurons that was stained with nuclear stain DAPI (blue) showing localization of the H2B-GFP fusion protein (green) in the nucleus. Scale bar: 25 µm. C) Schematic of a coronal brain section in reference to Bregma with a red box indicating the areas shown in D. D) Confocal fluorescence images of coronal striatal sections stained with DAPI (blue) prepared at increasing time points following injection of ssAAV (top row) or scAAV (bottom row). Green GFP expression in neurons becomes visible in ssAAV at eight days, whereas scAAV leads to earlier expression already at three days after injection. Scale bars: 250 µm. E) Cumulative distributions of mean fluorescence in the green channel of individual nuclei identified based on DAPI signal. Each line corresponds to the distribution of a brain section from one injected mouse (region of interest with a fixed size corresponding to approx. 15028±341 (mean±SEM) cells). Fluorescence measurements below 2.6 AU correspond mostly to non-expressing cells (e.g. 12 hour time point), whereas an appreciable fraction of cells in the striatum show intensities well above 2.6 AU as can be seen following longer incubation periods (e.g. 21 day time point). Dashed vertical line corresponds to 2.6 AU threshold. Two sections from two injected mice per virus type were analyzed on each time point. F) Fraction of cells within region of interest that show fluorescence levels higher than 2.6 AU corresponding to classification of ‘GFP-expressing’ (Bars represent mean of two mice). G) Mean fluorescence of all cells with intensities higher than 2.6 AU. Note that not only the number of ‘GFP-expressing’ cells increases with time, but also their intensity levels.

References

    1. White MD, Milne RV, Nolan MF (2011) A Molecular Toolbox for Rapid Generation of Viral Vectors to Up- or Down-Regulate Neuronal Gene Expression in vivo. Front. J Mol Neurosci 4: 8. - PMC - PubMed
    1. Luo L, Callaway EM, Svoboda K (2008) Genetic dissection of neural circuits. Neuron 57: 634-660. doi:10.1016/j.neuron.2008.01.002. PubMed: 18341986. - DOI - PMC - PubMed
    1. Tye KM, Prakash R, Kim SY, Fenno LE, Grosenick L et al. (2011) Amygdala circuitry mediating reversible and bidirectional control of anxiety. Nature 471: 358-362. doi:10.1038/nature09820. PubMed: 21389985. - DOI - PMC - PubMed
    1. Huber D, Gutnisky DA, Peron S, O’Connor DH, Wiegert JS et al. (2012) Multiple dynamic representations in the motor cortex during sensorimotor learning. Nature 484: 473-478. doi:10.1038/nature11039. PubMed: 22538608. - DOI - PMC - PubMed
    1. Haubensak W, Kunwar PS, Cai H, Ciocchi S, Wall NR et al. (2010) Genetic dissection of an amygdala microcircuit that gates conditioned fear. Nature 468: 270-276. doi:10.1038/nature09553. PubMed: 21068836. - DOI - PMC - PubMed

Publication types