. 2013 Oct 15;85(20):9671-7.
doi: 10.1021/ac401985r. Epub 2013 Oct 2.

New generation of ensemble-decision aliquot ranking based on simplified microfluidic components for large-capacity trapping of circulating tumor cells

Affiliations

New generation of ensemble-decision aliquot ranking based on simplified microfluidic components for large-capacity trapping of circulating tumor cells

Mengxia Zhao et al. Anal Chem. .

Abstract

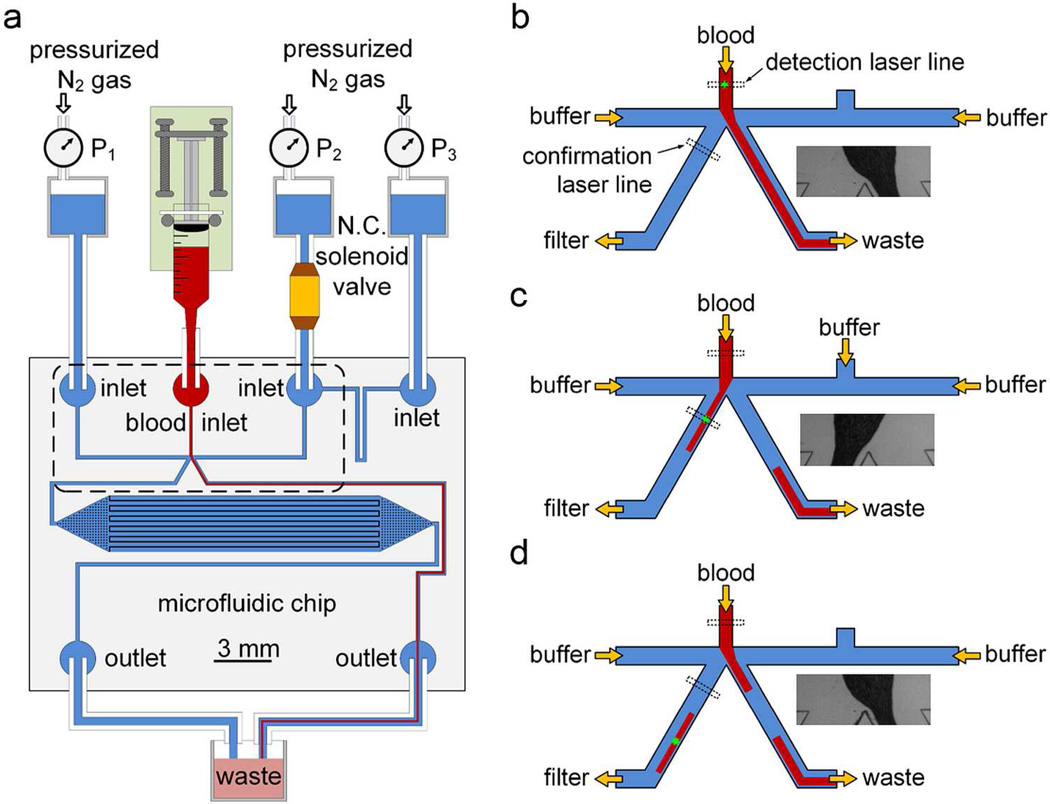
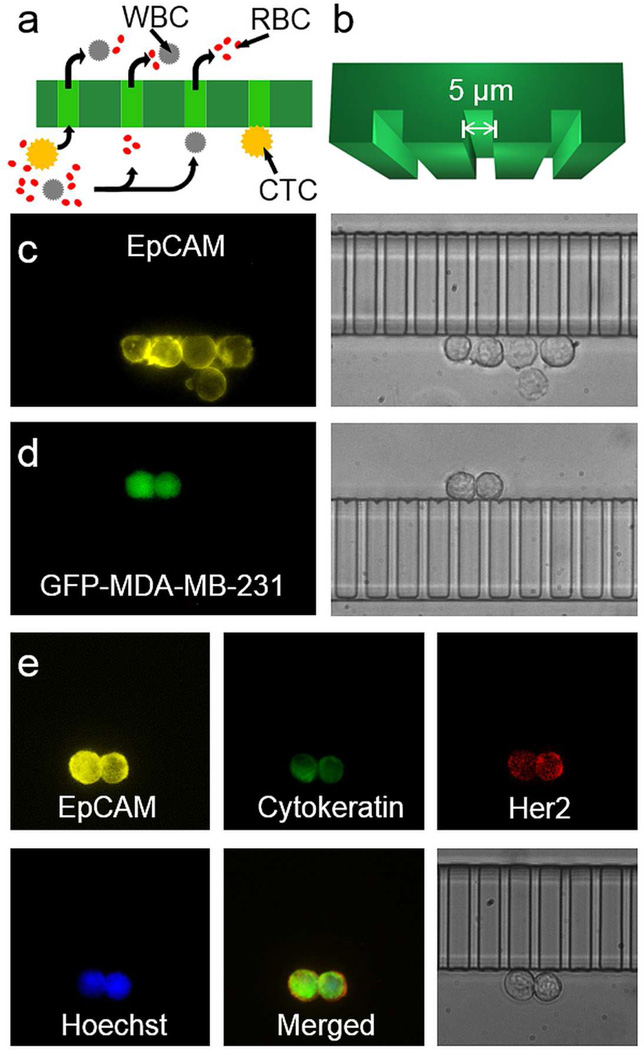
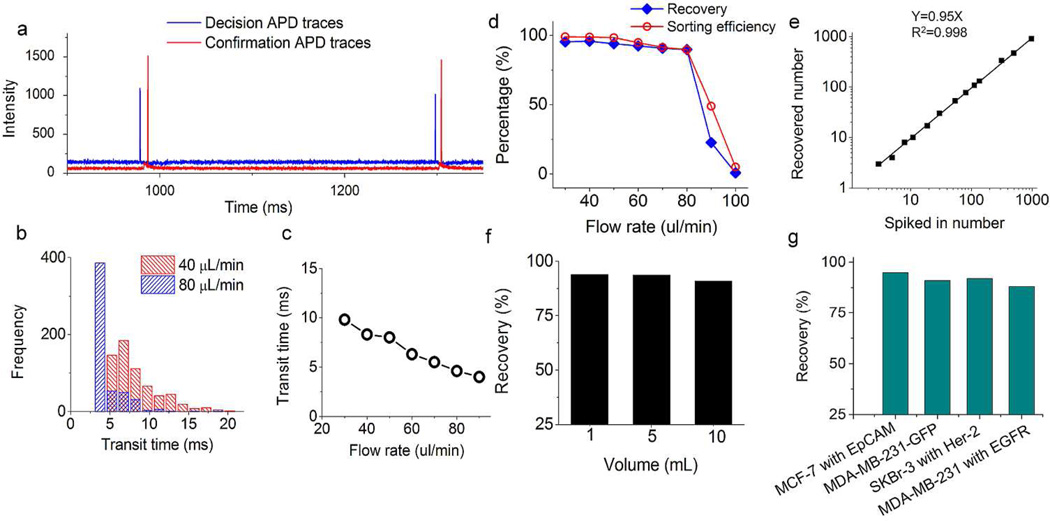
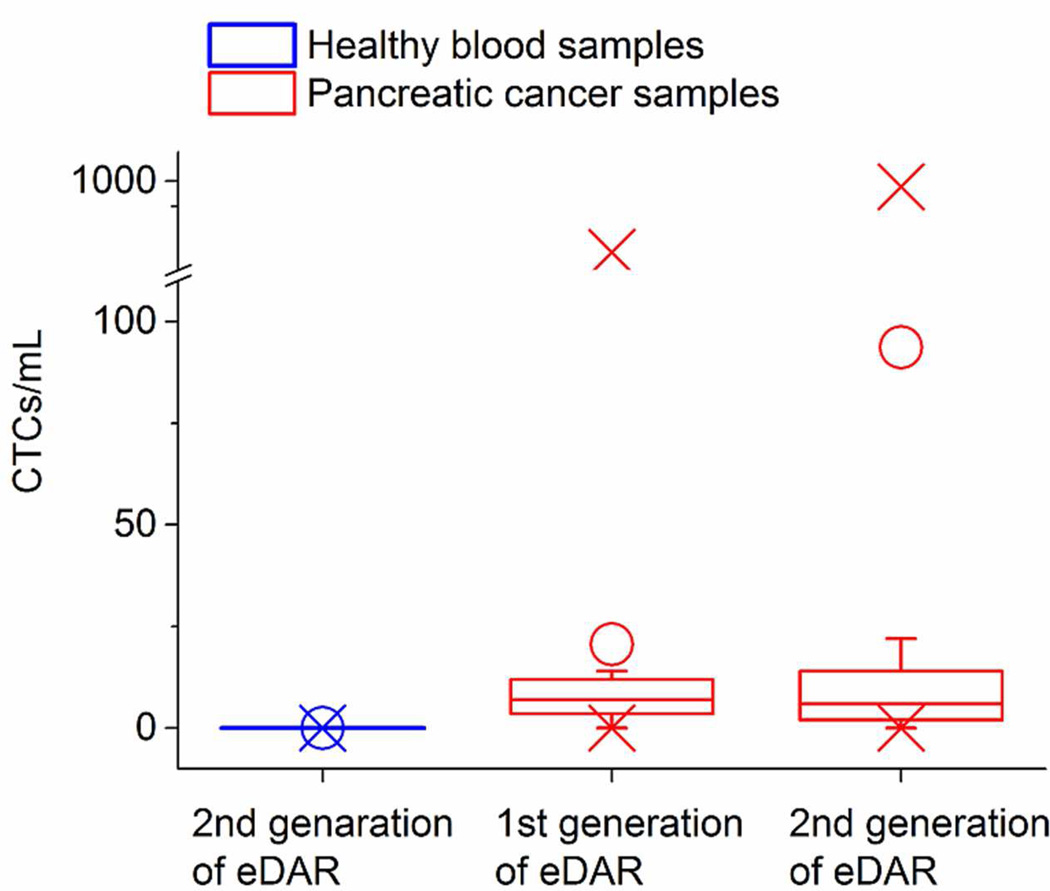
Ensemble-decision aliquot ranking (eDAR) is a sensitive and high-throughput method to analyze circulating tumor cells (CTCs) from peripheral blood. Here, we report the next generation of eDAR, where we designed and optimized a new hydrodynamic switching scheme for the active sorting step in eDAR, which provided fast cell sorting with an improved reproducibility and stability. The microfluidic chip was also simplified by incorporating a functional area for subsequent purification using microslits fabricated by standard lithography method. Using the reported second generation of eDAR, we were able to analyze 1 mL of whole-blood samples in 12.5 min, with a 95% recovery and a zero false positive rate (n = 15).


Conflict of interest statement

Conflict of interest

The authors declare the following competing financial interest(s): D.T.C. and P.G.S. have financial interest in MiCareo, which has licensed the described technology from the University of Washington.

Figures

Figure 1
Figure 1
Microfluidic chip and hydrodynamic switching scheme of eDAR. a) General structure of the microfluidic chip and the configuration of the eDAR platform. The bottom left channel was to collect sorted aliquots and transfer them to the subsequent purification area, which had 20,000 microslits. The area marked with a dashed box is further explained in b-d. b) The flow condition when no positive aliquot was ranked. c) The blood flow was switched to the CTC collection channel, and the sorted aliquot was confirmed by the second APD. d) The blood flow was switched back after the aliquot was sorted.
Figure 2
Figure 2
Microslits and multicolor fluorescence imaging of captured CTCs. a) The sorted aliquots were further purified through the array of microslits. Objects in yellow represent CTCs; red and grey objects represent RBCs and WBCs, respectively. The curved arrows show the flow paths across the microslits. b) The 3D model of the microslits with a 5-µm height and a 5-µm width. c) Fluorescence (left) and bright field (right) images of five MCF-7 cells captured via eDAR. d) Fluorescence (left) and bright field (right) images of two MDA-MB-231-GFP cells captured based on their GFP signal without any prelabeling. E) Two SKBr-3 cells were captured by eDAR, and further labeled with additional markers.
Figure 3
Figure 3
Characterization and analytical performances of eDAR. a) The segment of the APD data from a pancreatic cancer sample that shows two events triggered the sorting which then were confirmed by the second detection window. b) The distribution of transit time at flow rates of 40 and 80 µL/min, respectively. c) A plot shows the fastest average transit time was about 4 ms when the flow rate was 90 µL/min. d) The recovery and sorting efficiency value versus different flow rate. e) The recovery ratio of MCF-7 cells spiked into whole blood. f) The recovery ratio of 300 MCF-7 cells spiked into 1, 5 and 10 mL of whole blood aliquots. g) The recovery ratio of 4 selection schemes of 4 breast cancer cell lines spiked into whole blood.
Figure 4
Figure 4
The distribution of 15 control samples and 10 pancreatic cancer samples analyzed by the method reported here, as well as the distribution of 16 pancreatic cancer samples analyzed by the first generation of eDAR. O shows the average values for each data set; X shows the minimum and maximum values we found in each data set.

References

    1. Chaffer CL, Weinberg RA. Science. 2011;331:1559–1564. - PubMed
    1. Mocellin S, Keilholz U, Rossi CR, Nitti D. Trends Mol. Med. 2006;12:130–139. - PubMed
    1. Pantel K, Alix-Panabieres C, Riethdorf S. Nat. Rev. Clin. Oncol. 2009;6:339–351. - PubMed
    1. Paterlini-Brechot P, Benali NL. Cancer Lett. 2007;253:180–204. - PubMed
    1. Andreopoulou E, Cristofanilli M. Expert Rev. Anticancer Ther. 2010;10:171–177. - PubMed

Publication types