. 2013 Oct 2:14:289.
doi: 10.1186/1471-2105-14-289.

Calculation of Tajima's D and other neutrality test statistics from low depth next-generation sequencing data

Affiliations

Calculation of Tajima's D and other neutrality test statistics from low depth next-generation sequencing data

Thorfinn Sand Korneliussen et al. BMC Bioinformatics. .

Abstract

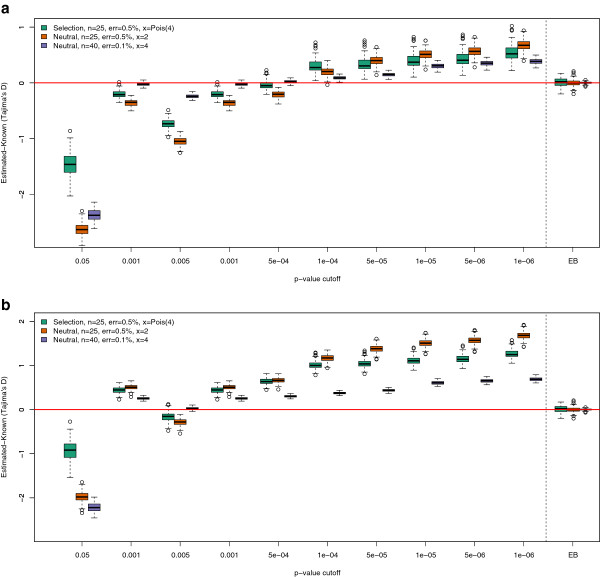
Background: A number of different statistics are used for detecting natural selection using DNA sequencing data, including statistics that are summaries of the frequency spectrum, such as Tajima's D. These statistics are now often being applied in the analysis of Next Generation Sequencing (NGS) data. However, estimates of frequency spectra from NGS data are strongly affected by low sequencing coverage; the inherent technology dependent variation in sequencing depth causes systematic differences in the value of the statistic among genomic regions.

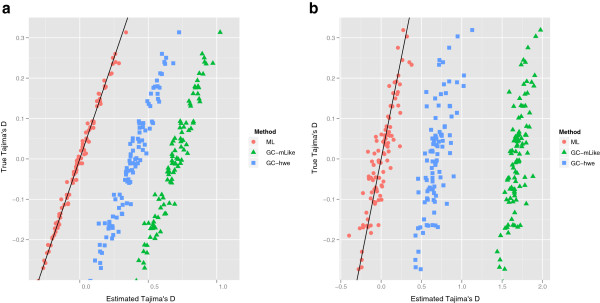
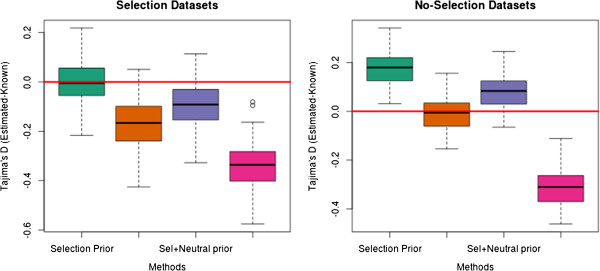
Results: We have developed an approach that accommodates the uncertainty of the data when calculating site frequency based neutrality test statistics. A salient feature of this approach is that it implicitly solves the problems of varying sequencing depth, missing data and avoids the need to infer variable sites for the analysis and thereby avoids ascertainment problems introduced by a SNP discovery process.

Conclusion: Using an empirical Bayes approach for fast computations, we show that this method produces results for low-coverage NGS data comparable to those achieved when the genotypes are known without uncertainty. We also validate the method in an analysis of data from the 1000 genomes project. The method is implemented in a fast framework which enables researchers to perform these neutrality tests on a genome-wide scale.


Figures

Figure 1
Figure 1
The effect of genotype calling for low or medium coverage data using Tajima’s D. The difference between estimated and known Tajima’s D statistic for three different scenarios with 10 different p-value cutoffs. Each box is estimated on the basis of 100 1 MB regions. Subfigure ‘a)’ is based on genotypes called using the frequency as prior, GC-hwe, and Subfigure ‘b)’ is based on genotypes called using a maximum likelihood approach, GC-mLike. We have included the EB method for the 3 different scenarios in the right side of the figures. Notice that no single best cutoff can be chosen across the three different scenarios for the genotype calling based methods.
Figure 2
Figure 2
The effect of SNP calling criteria on the variance when calling genotypes. Comparison of the difference between our estimated Tajima’s D and the known Tajima’s D. These plots are based on a scenario with depth 2× and error rate 0.5% and show the difference of different p-values used for the LRT test. Left figure is the selection dataset and right figure is the neutral dataset. Notice that the 10-6 cutoff has quite the same variance in both plots. We observe that the 10-3 cutoff has less variance on the selection dataset, but more variance in the neutral dataset. We see the opposite correlation with regards to the 5 × 10-5 cutoff.
Figure 3
Figure 3
Estimating Tajima’s D using ML estimates of the SFS. These two plots are based on neutral sets of scenario, each plotted data point is an estimate of Tajima’s D for a 1 Mb region. Subfigure ‘a)’ is high depth (8×), with an error rate of 1.0% and using a p-value of 10-6 and subfigure ‘b)’ is low depth (2×) with an error rate of 0.5%. For our full ML method in the high depth scenario all values fall in the vicinity of the y = x line, but shows higher variance for the low depth as expected. Notice that for the stringent cutoff both genotype calling methods overestimates.
Figure 4
Figure 4
The effect of sample size and sequencing depth. Boxplot of our estimated values minus the known value. The green/orange boxes indicate our full maximum likelihood method, whereas the other boxes are the genotype calling methods. We have generated 10 scenarios with and without selection, therefore each box represents different scenarios each with 100 data points estimated on the basis of the 100 × 1 Mb datasets. For these analysis we used a p-value of 10-6. Notice that the full ML method is mostly unbiased, but the variance is affected by the error rate and sequencing depth as expected. The genotype calling shows large biases that depend on sequencing depth, error rate and whether or not the region is under selection or not.
Figure 5
Figure 5
Difference between our estimators under a selective sweep. Mean value for our estimated Tajima’s D, for every 50 kb windows for 100 1 MB region for 25 samples. For the most progressive LRT cutoff some windows did not have data. This plot is based on a depth of 2× and an error rate of 0.5%. Figure a) is using the raw Tajima’s D estimate for the genotype calling methods. In Figure b) we have standardized the genotype calling methods relative to the estimates from a dataset of 100 1 MB neutrally evolving regions.
Figure 6
Figure 6
Difference between the full ML and the EB method under a selective sweep. Difference between estimated Tajima’s D and known Tajima’s D, left plot ‘a)’ is using the ML for every 50 kb region, right figure ‘b)’ is using the EB approach with a 1 Mb estimated SFS as prior for all 50 kb regions. The targeted site for selection is in the middle and we see that the local 50 kb ML has some very positive outliers in this region. This is contrasted by the EB method where we have some negative outliers. However we can see that the median for the EB method in the middle region is shifted to a positive value, whereas the median for the 50 kb ML is overall relatively close to zero. Also notice the difference of scaling in the y-axis.
Figure 7
Figure 7
Effect of different priors for the EB method using the Tajima’s D test statistic. Boxplots for the difference between our estimate of Tajima’s D and the known value, the orange box is the neutral genome-wide prior. These plots are based on a depth of 2× and an error rate of 0.5%.
Figure 8
Figure 8
Applications to real data. Genomic scans using a sliding window approach of 10 kb. The UCSC Tajima track was downloaded from the UCSC genome browser, and was shifted relatively to LCT gene on the hg19 human assembly. The vertical red line indicates window centers where the EB method (100 kb window) has a Tajima’s D below−1.8. Figure a) is using our EB method with varying window sizes. Figure b) is our EB method together with the genotype calling methods. We tried with varying p-value cutoffs for the genotype calling methods, and are using a window size of 100 kb.

References

    1. Nielsen R. Molecular signatures of natural selection. Annu Rev Genet. 2005;14:197–218. doi: 10.1146/annurev.genet.39.073003.112420. - DOI - PubMed
    1. Voight BF, Kudaravalli S, Wen X, Pritchard JK. A map of recent positive selection in the human genome. PLoS Biol. 2006;14(3):e72. doi: 10.1371/journal.pbio.0040072. - DOI - PMC - PubMed
    1. Sabeti PC, Varilly P, Fry B. et al. Genome-wide detection and characterization of positive selection in human populations. Nature. 2007;14:913–918. doi: 10.1038/nature06250. - DOI - PMC - PubMed
    1. Pickrell JK, Coop G, Novembre J, Kudaravalli S, Li JZ, Absher D, Srinivasan BS, Barsh GS, Myers RM, Feldman MW, Pritchard JK. Signals of recent positive selection in a worldwide sample of human populations. Genome Res. 2009;14(5):826–837. doi: 10.1101/gr.087577.108. - DOI - PMC - PubMed
    1. Bersaglieri T, Sabeti PC, Patterson N, Vanderploeg T, Schaffner SF, Drake JA, Rhodes M, Reich DE, Hirschhorn JN. Genetic signatures of strong recent positive selection at the lactase gene. Am J Hum Genet. 2004;14:1111–1120. doi: 10.1086/421051. - DOI - PMC - PubMed

Publication types