

Glycaemic control in Australia and New Zealand before and after the NICE-SUGAR trial: a translational study
- PMID: 24088368
- PMCID: PMC4056083
- DOI: 10.1186/cc13030
Glycaemic control in Australia and New Zealand before and after the NICE-SUGAR trial: a translational study
Abstract
Introduction: There is no information on the uptake of Intensive Insulin Therapy (IIT) before the Normoglycemia in Intensive Care Evaluation and Surviving Using Glucose Algorithm Regulation (NICE-SUGAR) trial in Australia and New Zealand (ANZ) and on the bi-national response to the trial, yet such data would provide important information on the evolution of ANZ practice in this field. We aimed to study ANZ glycaemic control before and after the publication of the results of the NICE-SUGAR trial.
Methods: We analysed glucose control in critically ill patients across Australia and New Zealand during a two-year period before and after the publication of the NICE-SUGAR study. We used the mean first day glucose (Glu1) (a validated surrogate of ICU glucose control) to define practice. The implementation of an IIT protocol was presumed if the median of Glu₁ measurements was <6.44 mmol/L for a given ICU. Hypoglycaemia was categorised as severe (glucose ≤2.2 mmol/L) or moderate (glucose ≤3.9 mmol/L).
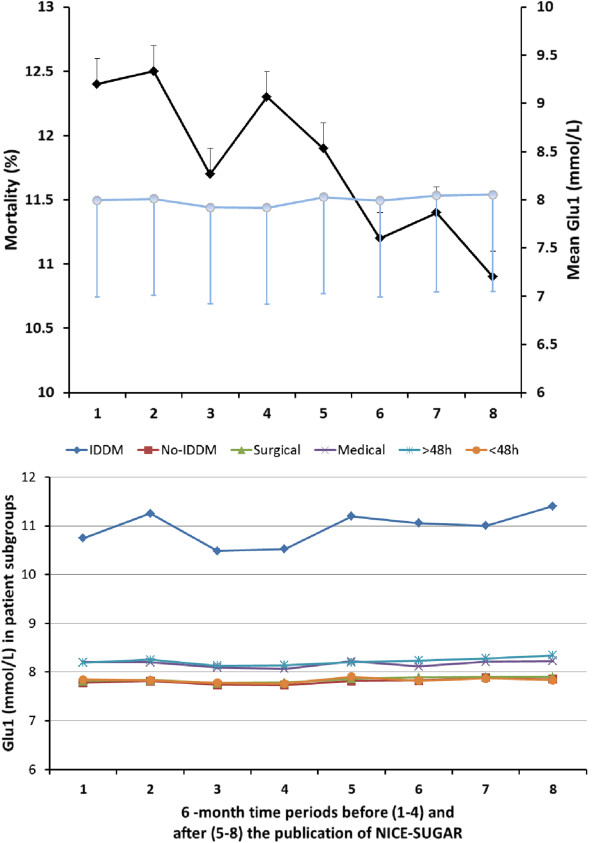
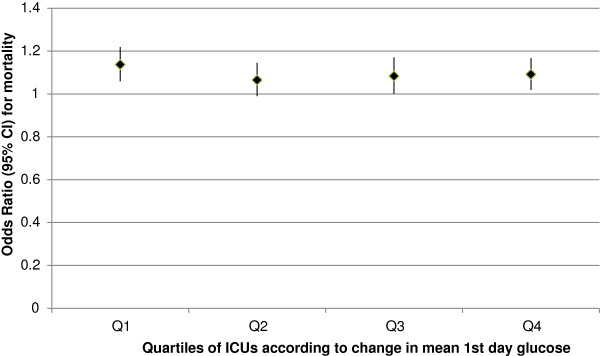
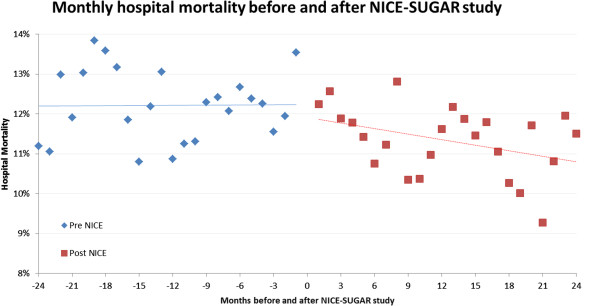
Results: We studied 49 ICUs and 176,505 patients. No ICU practiced IIT before or after NICE-SUGAR. Overall, Glu1 increased from 7.96 (2.95) mmol/L to 8.03 (2.92) mmol/L (P <0.0001) after NICE-SUGAR. Similar increases were noted in all patient subgroups studied (surgical, medical, insulin dependent diabetes mellitus, ICU stay >48/<48 hours). The rate of severe and moderate hypoglycaemia before and after NICE-SUGAR study were 0.59% vs. 0.55% (P =0.33) and 6.62% vs. 5.68% (P <0.0001), respectively. Both crude and adjusted mortalities declined over the study period.
Conclusions: IIT had not been adopted in ANZ before the NICE-SUGAR study and glycaemic control corresponded to that delivered in the control arm of NICE-SUGAR trial. There were only minor changes in practice after the trial toward looser glycaemic control. The rate of moderate hypoglycaemia and mortality decreased along with such changes.
Figures

Comment in
-
Choosing the correct metrics for glucose control.Crit Care. 2014 Mar 5;18(2):414. doi: 10.1186/cc13758. Crit Care. 2014. PMID: 25029332 Free PMC article. No abstract available.
-
Choosing the correct metrics for glucose control. Authors' reply.Crit Care. 2014 Mar 5;18(2):414. Crit Care. 2014. PMID: 25180350 No abstract available.
Similar articles
-
Glycaemic control and long-term outcomes following transition from modified intensive insulin therapy to conventional glycaemic control.Anaesth Intensive Care. 2014 Mar;42(2):239-47. doi: 10.1177/0310057X1404200212. Anaesth Intensive Care. 2014. PMID: 24580391
-
Implementation and evaluation of the SPRINT protocol for tight glycaemic control in critically ill patients: a clinical practice change.Crit Care. 2008;12(2):R49. doi: 10.1186/cc6868. Epub 2008 Apr 16. Crit Care. 2008. PMID: 18412978 Free PMC article.
-
Critique of normoglycemia in intensive care evaluation: survival using glucose algorithm regulation (NICE-SUGAR)--a review of recent literature.Curr Opin Clin Nutr Metab Care. 2010 Mar;13(2):211-4. doi: 10.1097/MCO.0b013e32833571f4. Curr Opin Clin Nutr Metab Care. 2010. PMID: 20010098 Review.
-
Effect of glycemic gap upon mortality in critically ill patients with diabetes.J Diabetes Investig. 2021 Dec;12(12):2212-2220. doi: 10.1111/jdi.13606. Epub 2021 Aug 3. J Diabetes Investig. 2021. PMID: 34075715 Free PMC article.
-
Perioperative glycemic management in 2011: paradigm shifts.Curr Opin Crit Care. 2011 Aug;17(4):370-5. doi: 10.1097/MCC.0b013e328348beb7. Curr Opin Crit Care. 2011. PMID: 21734491 Review.
Cited by
-
Using the glucometrics website to benchmark ICU glucose control before and after the NICE-SUGAR study.J Diabetes Sci Technol. 2014 Sep;8(5):918-22. doi: 10.1177/1932296814540871. Epub 2014 Jul 10. J Diabetes Sci Technol. 2014. PMID: 25013157 Free PMC article.
-
Insulin treatment guided by subcutaneous continuous glucose monitoring compared to frequent point-of-care measurement in critically ill patients: a randomized controlled trial.Crit Care. 2014 Aug 20;18(4):453. doi: 10.1186/s13054-014-0453-9. Crit Care. 2014. PMID: 25139609 Free PMC article. Clinical Trial.
-
Hyperglycemia in acute heart failure: an opportunity to intervene?Curr Heart Fail Rep. 2014 Sep;11(3):241-5. doi: 10.1007/s11897-014-0205-9. Curr Heart Fail Rep. 2014. PMID: 24890901 Review.
-
Choosing the correct metrics for glucose control.Crit Care. 2014 Mar 5;18(2):414. doi: 10.1186/cc13758. Crit Care. 2014. PMID: 25029332 Free PMC article. No abstract available.
-
Don't Sugar Coat It: Glycemic Control in the Intensive Care Unit.J Intensive Care Med. 2019 Nov-Dec;34(11-12):889-896. doi: 10.1177/0885066618801748. Epub 2018 Oct 11. J Intensive Care Med. 2019. PMID: 30309291 Free PMC article. Review.
References
-
- Christiansen C, Toft P, Jorgensen HS, Andersen SK, Tonnesen E. Hyperglycaemia and mortality in critically ill patients. A prospective study. Intensive Care Med. 2004;17:1685–1688. - PubMed
-
- Siegelaar SE, Hermanides J, Oudemans-van Straaten HM, van der Voort PH, Bosman RJ, Zandstra DF, DeVries JH. Mean glucose during ICU admission is related to mortality by a U-shaped curve in surgical and medical patients: a retrospective cohort study. Crit Care. 2010;17:R224. doi: 10.1186/cc9369. - DOI - PMC - PubMed
Publication types
MeSH terms
Substances
LinkOut - more resources
Full Text Sources
Other Literature Sources
Medical
