

Losartan reverses permissive epigenetic changes in renal glomeruli of diabetic db/db mice
- PMID: 24088954
- PMCID: PMC3946617
- DOI: 10.1038/ki.2013.387
Losartan reverses permissive epigenetic changes in renal glomeruli of diabetic db/db mice
Abstract
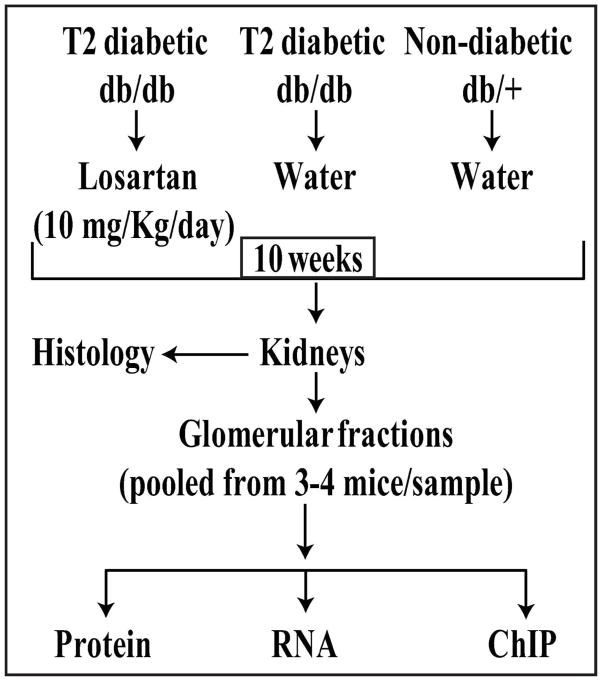
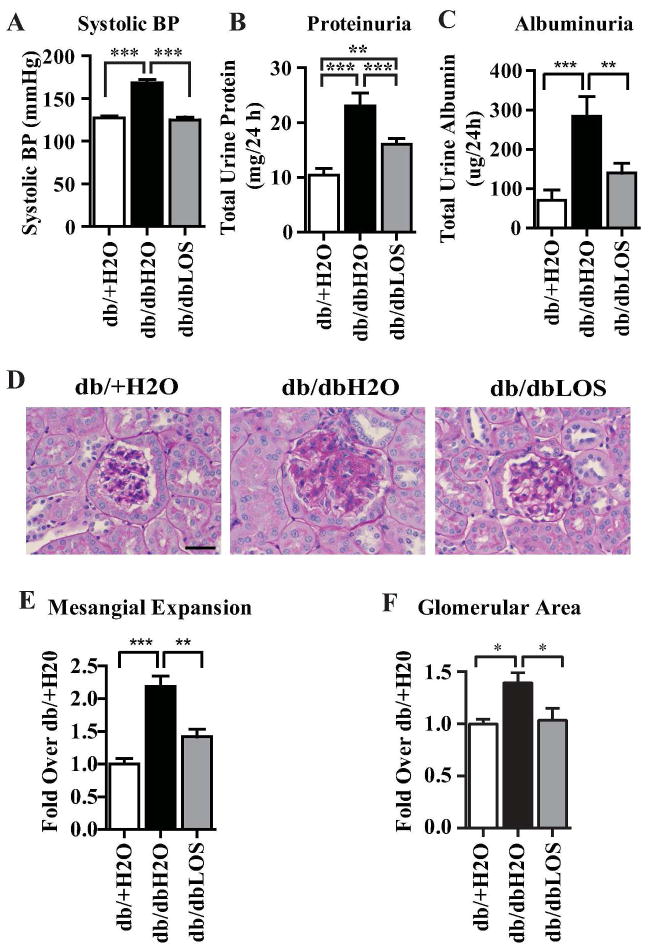
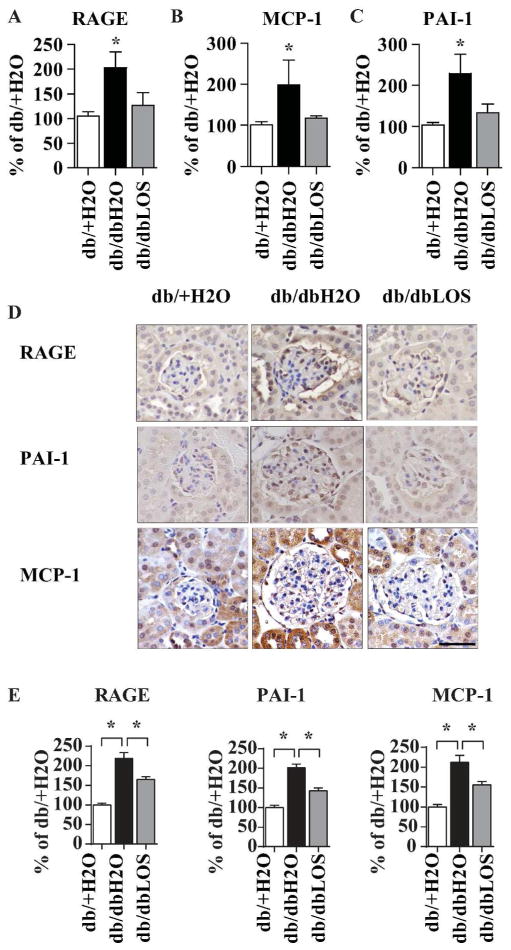
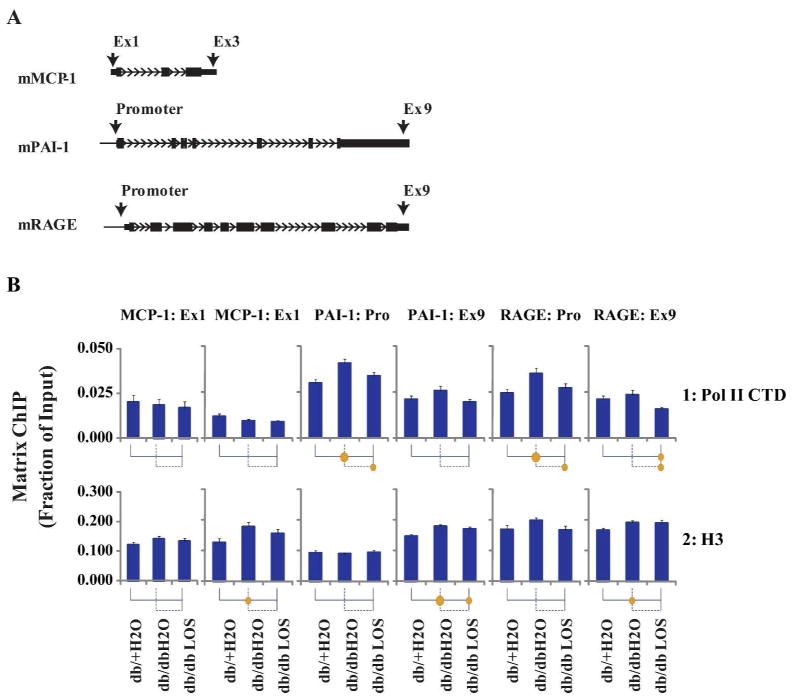
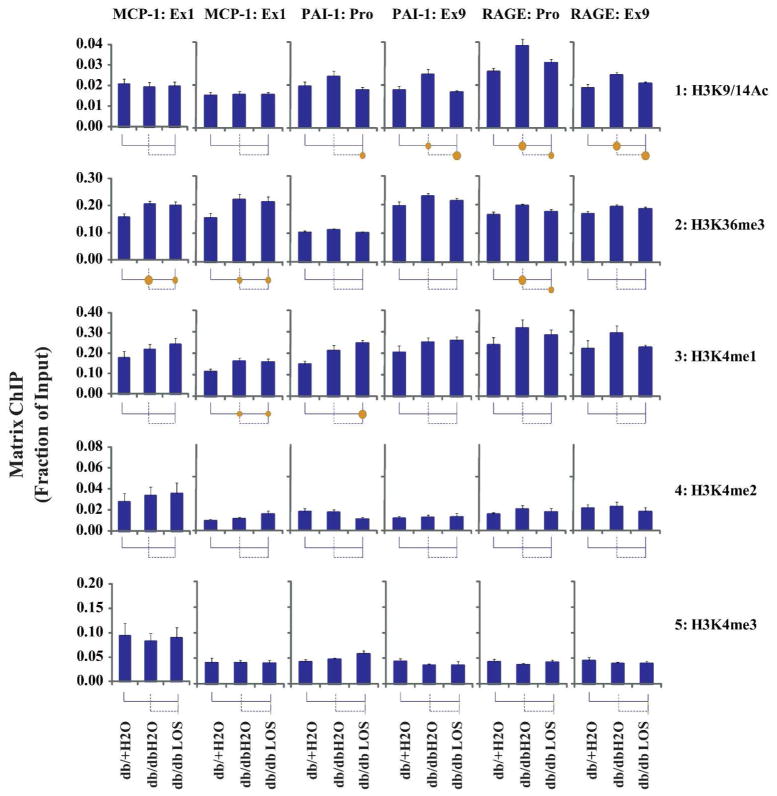
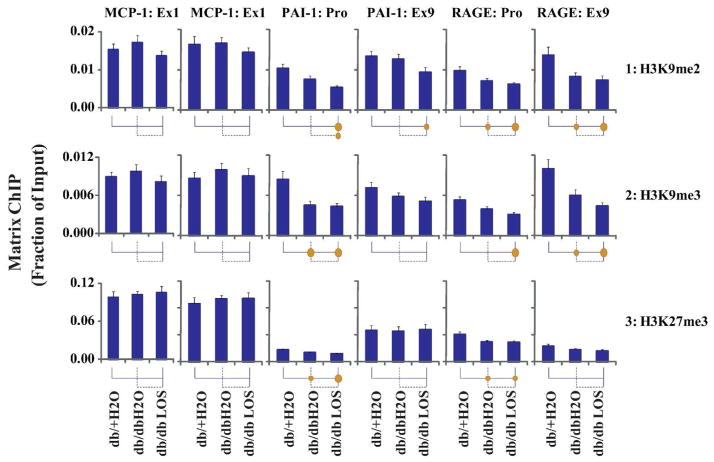
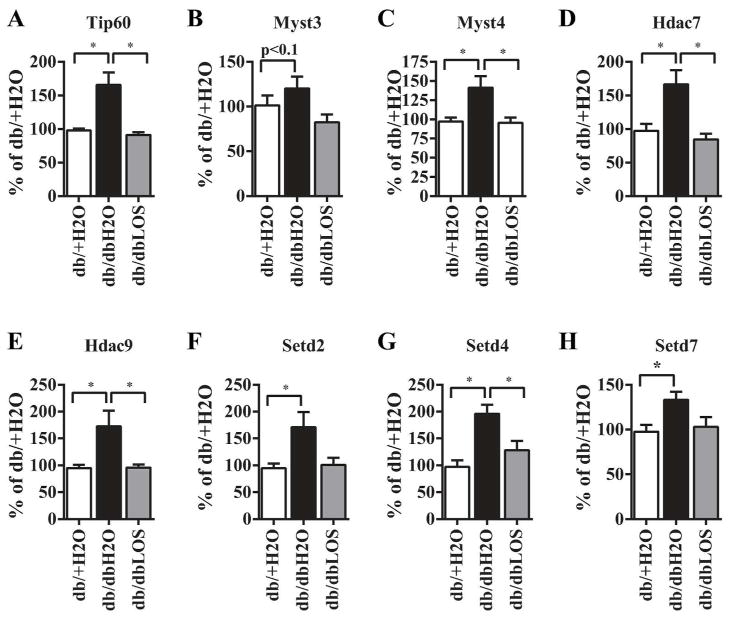
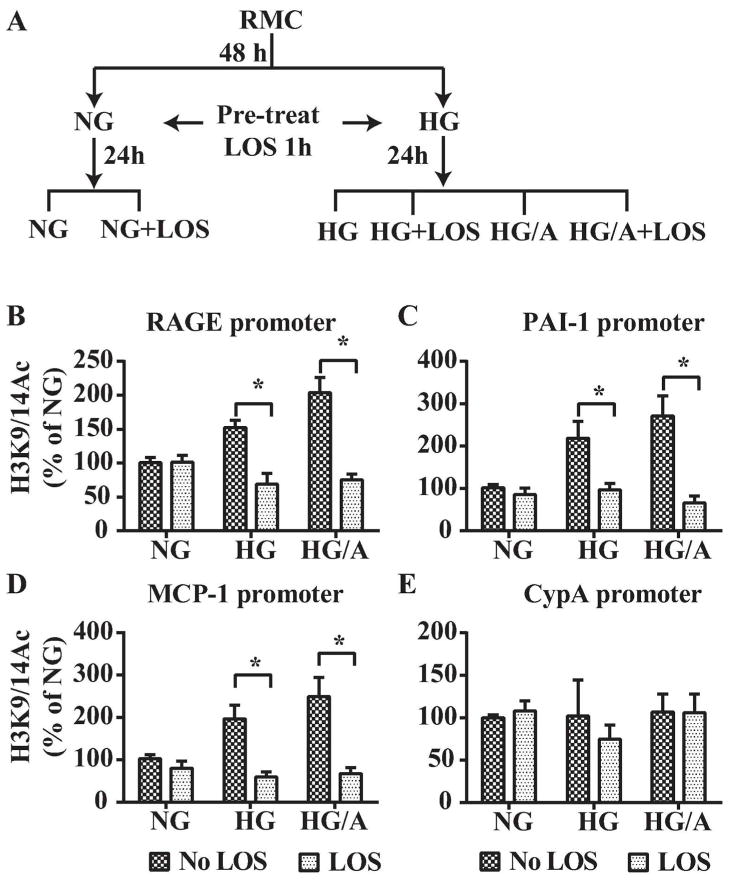
Epigenetic mechanisms such as chromatin histone H3 lysine methylation and acetylation have been implicated in diabetic vascular complications. However, histone modification profiles at pathologic genes associated with diabetic nephropathy in vivo and their regulation by the angiotensin II type 1 receptor (AT1R) are not clear. Here we tested whether treatment of type 2 diabetic db/db mice with the AT1R blocker losartan not only ameliorates diabetic nephropathy, but also reverses epigenetic changes. As expected, the db/db mice had increased blood pressure, mesangial hypertrophy, proteinuria, and glomerular expression of RAGE and PAI-1 vs. control db/+ mice. This was associated with increased RNA polymerase II recruitment and permissive histone marks as well as decreased repressive histone marks at these genes, and altered expression of relevant histone modification enzymes. Increased MCP-1 mRNA levels were not associated with such epigenetic changes, suggesting post-transcriptional regulation. Losartan attenuated key parameters of diabetic nephropathy and gene expression, and reversed some but not all the epigenetic changes in db/db mice. Losartan also attenuated increased H3K9/14Ac at RAGE, PAI-1, and MCP-1 promoters in mesangial cells cultured under diabetic conditions. Our results provide novel information about the chromatin state at key pathologic genes in vivo in diabetic nephropathy mediated in part by AT1R. Thus, combination therapies targeting epigenetic regulators and AT1R could be evaluated for more effective treatment of diabetic nephropathy.
Figures
Similar articles
-
Involvement of p300/CBP and epigenetic histone acetylation in TGF-β1-mediated gene transcription in mesangial cells.Am J Physiol Renal Physiol. 2013 Mar 1;304(5):F601-13. doi: 10.1152/ajprenal.00523.2012. Epub 2012 Dec 12. Am J Physiol Renal Physiol. 2013. PMID: 23235480 Free PMC article.
-
Combined vitamin D analog and AT1 receptor antagonist synergistically block the development of kidney disease in a model of type 2 diabetes.Kidney Int. 2010 Jun;77(11):1000-9. doi: 10.1038/ki.2010.22. Epub 2010 Feb 24. Kidney Int. 2010. PMID: 20182412
-
Progressive glomerulosclerosis in type 2 diabetes is associated with renal histone H3K9 and H3K23 acetylation, H3K4 dimethylation and phosphorylation at serine 10.Nephrol Dial Transplant. 2010 Jun;25(6):1811-7. doi: 10.1093/ndt/gfp730. Epub 2010 Jan 12. Nephrol Dial Transplant. 2010. PMID: 20067909
-
Recent insights into diabetic renal injury from the db/db mouse model of type 2 diabetic nephropathy.Am J Physiol Renal Physiol. 2011 Feb;300(2):F301-10. doi: 10.1152/ajprenal.00607.2010. Epub 2010 Dec 8. Am J Physiol Renal Physiol. 2011. PMID: 21147843 Review.
-
Losartan in diabetic nephropathy.Expert Rev Cardiovasc Ther. 2004 Jul;2(4):473-83. doi: 10.1586/14779072.2.4.473. Expert Rev Cardiovasc Ther. 2004. PMID: 15225108 Review.
Cited by
-
AT1 and AT2 receptors modulate renal tubular cell necroptosis in angiotensin II-infused renal injury mice.Sci Rep. 2019 Dec 19;9(1):19450. doi: 10.1038/s41598-019-55550-8. Sci Rep. 2019. PMID: 31857626 Free PMC article.
-
Epigenetic DNA Methylation and Protein Homocysteinylation: Key Players in Hypertensive Renovascular Damage.Int J Mol Sci. 2024 Oct 29;25(21):11599. doi: 10.3390/ijms252111599. Int J Mol Sci. 2024. PMID: 39519150 Free PMC article. Review.
-
Role of Epigenetic Changes in the Pathophysiology of Diabetic Kidney Disease.Glomerular Dis. 2024 Nov 13;4(1):211-226. doi: 10.1159/000541923. eCollection 2024 Jan-Dec. Glomerular Dis. 2024. PMID: 39649441 Free PMC article. Review.
-
Protective effects of Notoginsenoside R2 on reducing lipid accumulation and mitochondrial dysfunction in diabetic nephropathy through regulation of c-Src.Chin Med. 2025 Jan 15;20(1):10. doi: 10.1186/s13020-024-01057-y. Chin Med. 2025. PMID: 39810230 Free PMC article.
-
Renin-angiotensin system inhibitors positively impact on multiple aging regulatory pathways: Could they be used to protect against human aging?Physiol Rep. 2024 Jun;12(12):e16094. doi: 10.14814/phy2.16094. Physiol Rep. 2024. PMID: 38924381 Free PMC article. Review.
References
-
- Ruggenenti P, Cravedi P, Remuzzi G. The RAAS in the pathogenesis and treatment of diabetic nephropathy. Nat Rev Nephrol. 2010;6:319–330. - PubMed
-
- Tesch GH, Lim AK. Recent insights into diabetic renal injury from the db/db mouse model of type 2 diabetic nephropathy. Am J Physiol Renal Physiol. 2011;300:F301–310. - PubMed
-
- Sanchez AP, Sharma K. Transcription factors in the pathogenesis of diabetic nephropathy. Expert Rev Mol Med. 2009;11:e13. - PubMed
Publication types
MeSH terms
Substances
Grants and funding
LinkOut - more resources
Full Text Sources
Other Literature Sources
Medical
Research Materials
Miscellaneous
