. 2013:4:2537.
doi: 10.1038/ncomms3537.

Condensin I associates with structural and gene regulatory regions in vertebrate chromosomes

Affiliations

Condensin I associates with structural and gene regulatory regions in vertebrate chromosomes

Ji Hun Kim et al. Nat Commun. 2013.

Abstract

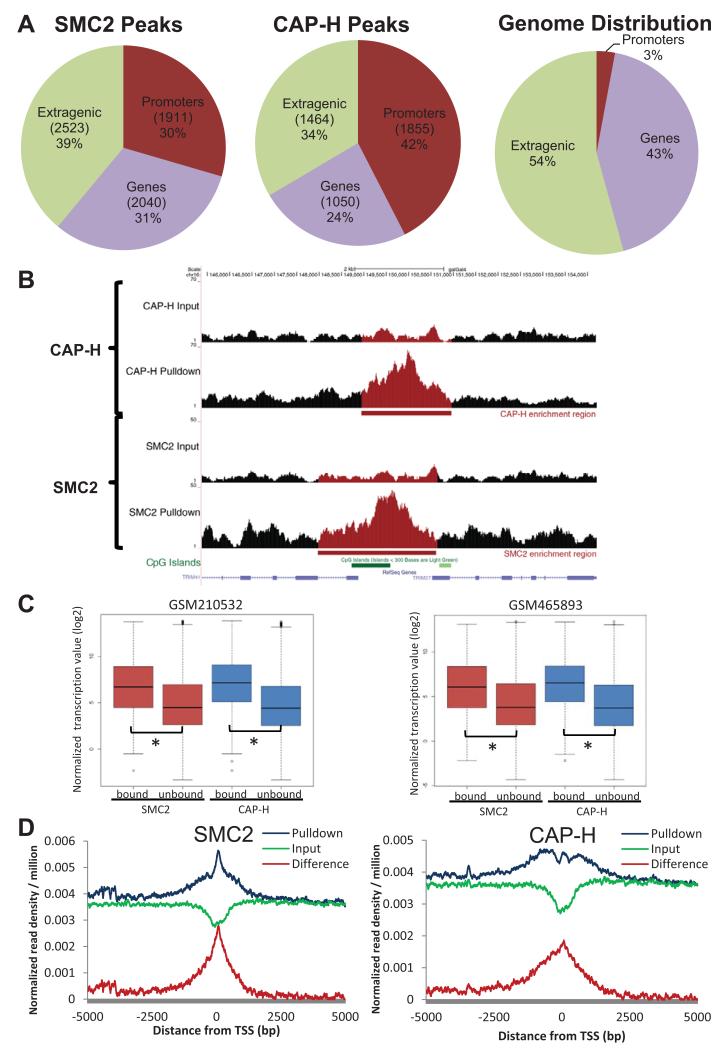
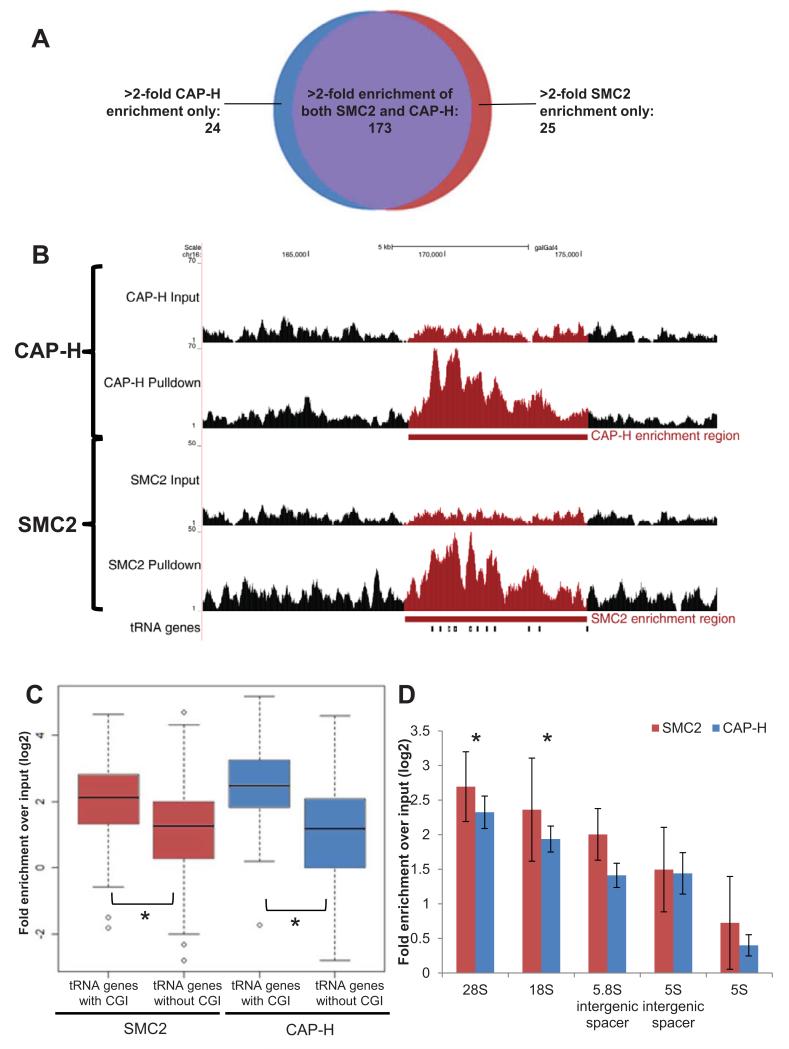
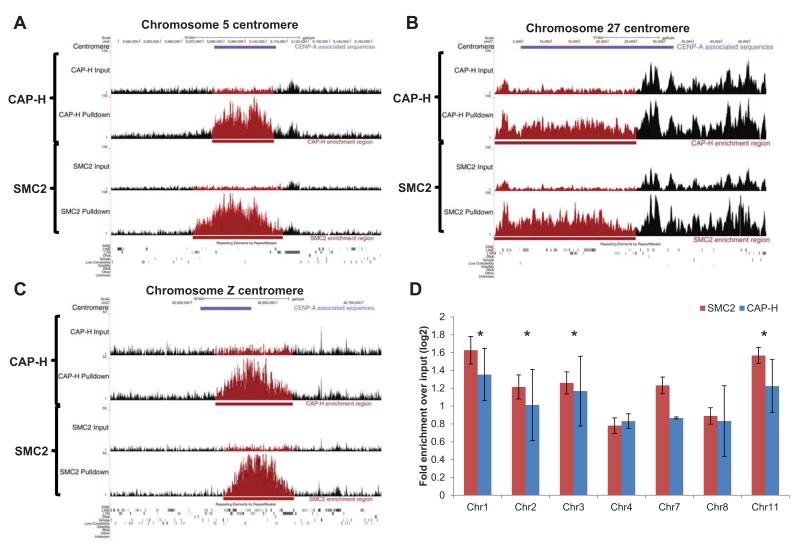
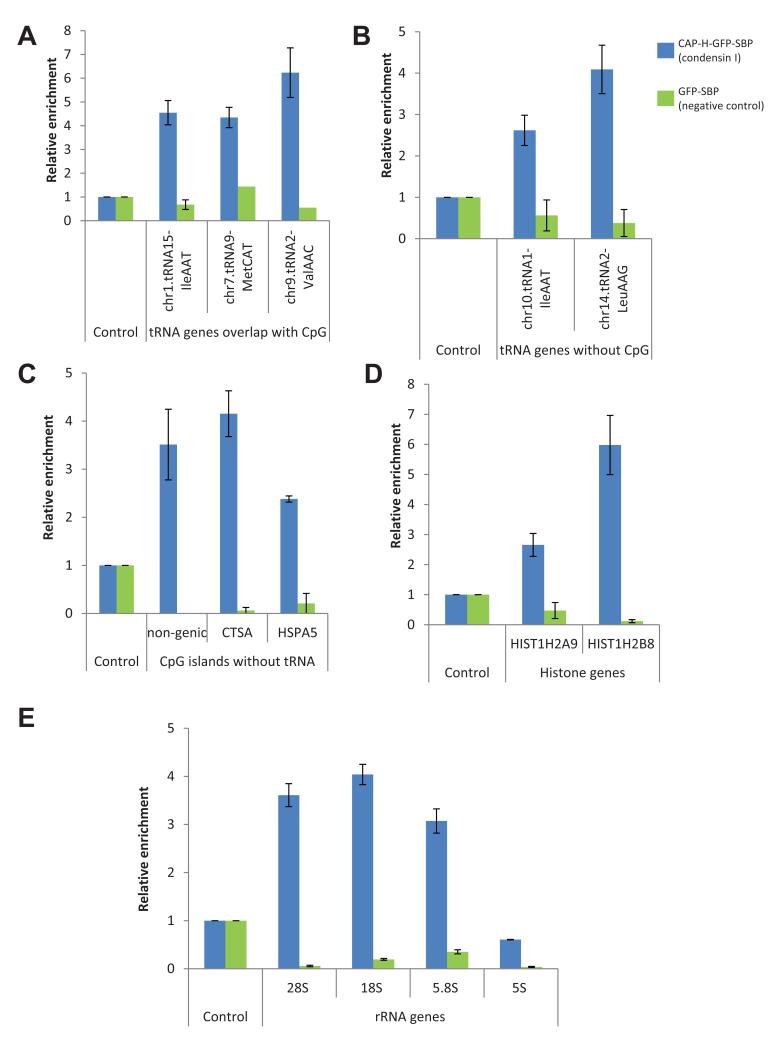
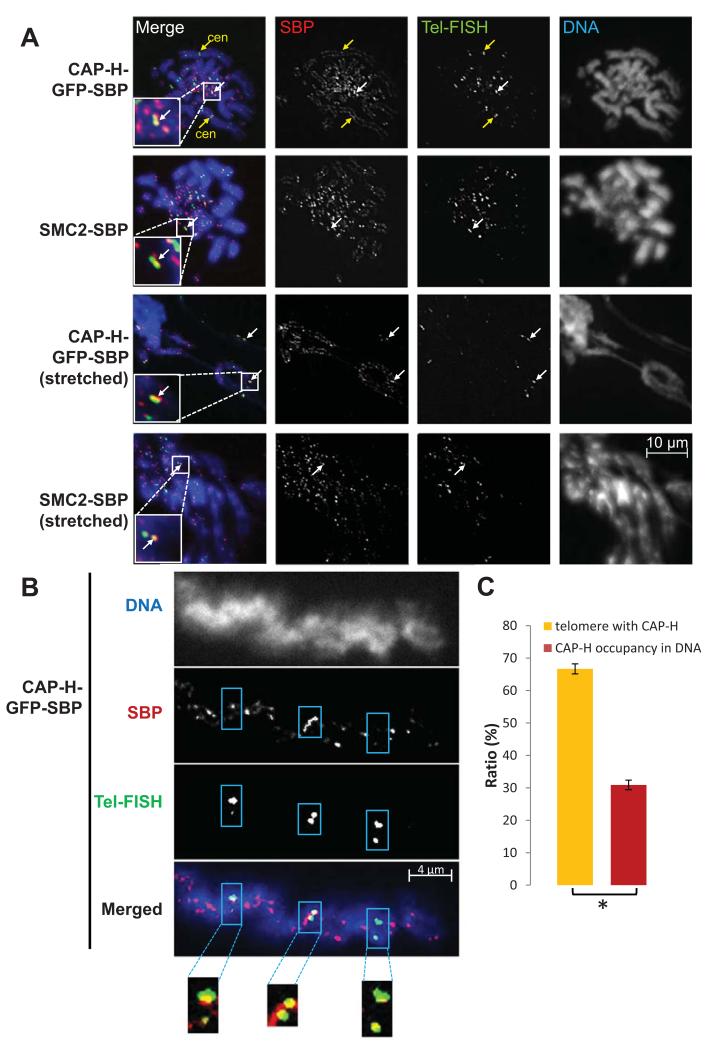
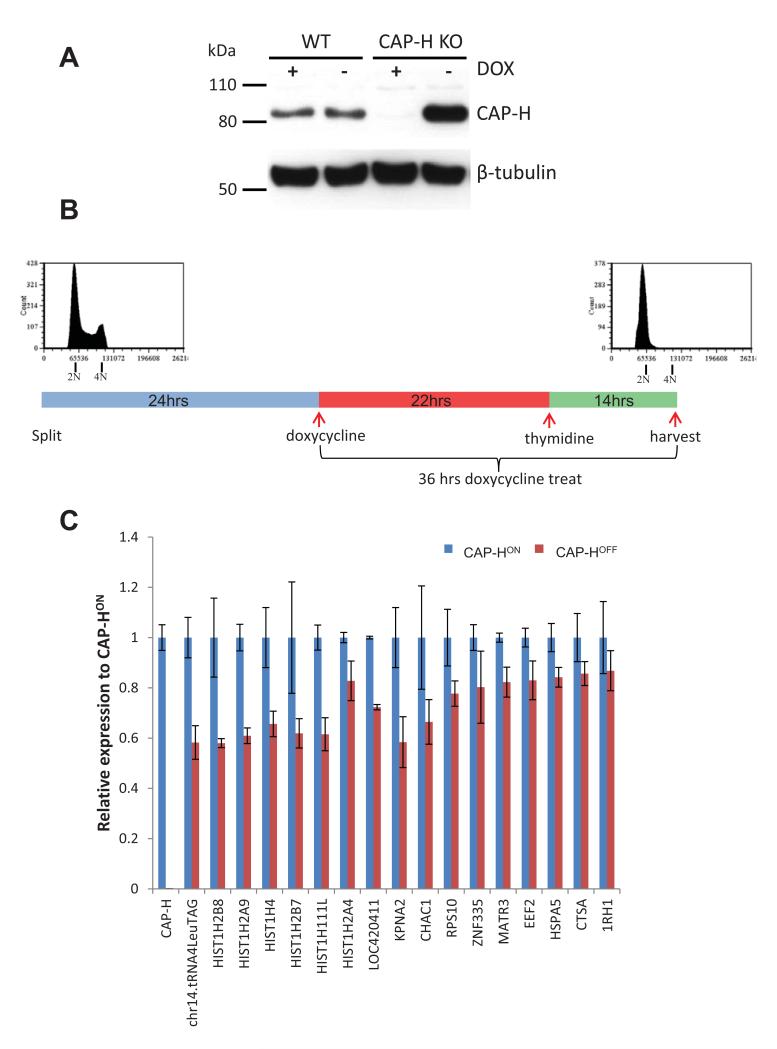
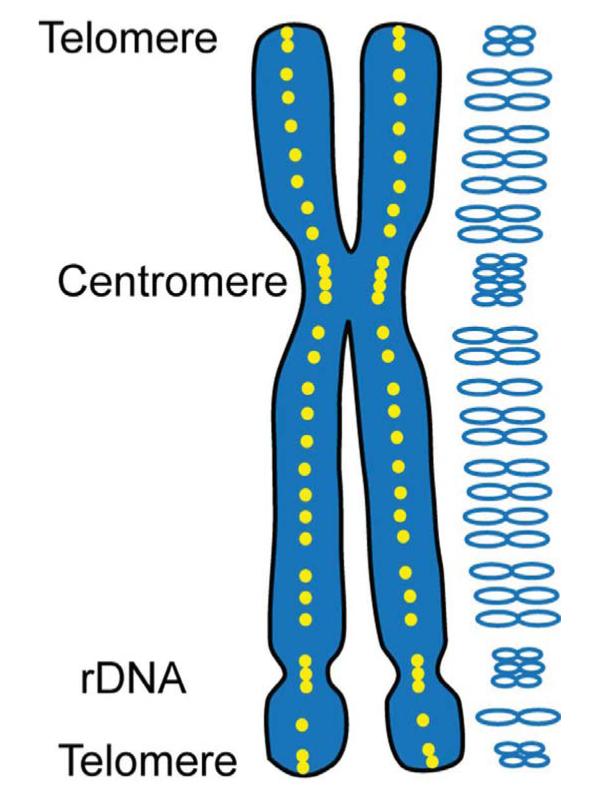
The condensin complex is essential for correct packaging and segregation of chromosomes during mitosis and meiosis in all eukaryotes. To date, the genome-wide location and the nature of condensin-binding sites have remained elusive in vertebrates. Here we report the genome-wide map of condensin I in chicken DT40 cells. Unexpectedly, we find that condensin I binds predominantly to promoter sequences in mitotic cells. We also find a striking enrichment at both centromeres and telomeres, highlighting the importance of the complex in chromosome segregation. Taken together, the results show that condensin I is largely absent from heterochromatic regions. This map of the condensin I binding sites on the chicken genome reveals that patterns of condensin distribution on chromosomes are conserved from prokaryotes, through yeasts to vertebrates. Thus in three kingdoms of life, condensin is enriched on promoters of actively transcribed genes and at loci important for chromosome segregation.


Figures

Figure 1
Figure 1. Enrichment of chicken condensin I complexes at promoter regions in mitotic chromosomes
(A) The landscape of SMC2 and CAP-H enrichment peak distribution at genomic features including promoters, genes, and extragenic sequences. The data shows the majority of enrichment regions for SMC2 or CAP-H are located in promoter regions. Enrichment peaks of SMC2 and CAP-H were independently called with respect to their input, and counted in these features. The numbers in the brackets are the raw peak number for each feature. Genomic distribution indicates the base-coverage of each feature in the chicken genome (galGal4). (B) CAP-H and SMC2 pulldown enrichment to input in the promoter regions for the bidirectional TRIM27 and TRIM41 genes. The coordinate of this view is chr16:145,376-154,212 of chicken galGal4 genome. (C) Condensin I binds actively transcribed genes. Transcription levels of NCBI RefSeq genes from wild-type DT40 cells were obtained from two independent Affymetrix data sets in Genome Expression Omnibus (GSM210532, GSM465893), and the transcription of SMC2 or CAP-H-peak-bound genes (1,531) and those without condensin peaks (9137) were compared. Transcription levels of 10,668 RefSeq genes of total 17,148 were available from the data sets. Y-axis represents normalized transcription values in log2. Note both p-values between condensin-bound and unbound genes (denoted by asterisk) in two independent Affymetrix data sets are <2.2×10⁻⁶ as calculated by Wilcoxon Rank Sum test. (D) High density of SMC2 and CAP-H sequence tags at transcription start sites (TSS) of all RefSeq genes in the chicken galGal4 genome assembly. Pulldown of SMC2 and CAP-H at (TSS) in the chicken genome is highly enriched compared to the input. The x-axis is the distance from the (TSS) up to 5 kb up and downstream, and y-axis is the normalized sequence read density. SMC2 or CAP-H pulldowns and input are shown as blue and green, respectively, and the read number difference between these two is in red.
Figure 2
Figure 2. Condensin I is abundant in non-coding RNA genes of chicken DT40 cells
(A) Venn diagram showing a large overlap between tRNA genes having greater than 2-fold SMC2 or CAP-H enrichment over the input (198 and 197 genes for SMC2 and CAP-H, respectively, of total 279 tRNA genes). The majority of those SMC2 and CAP-H enriched genes overlap (173 genes). The enrichment is measured by total sequence read counts of SMC2 or CAP-H over all known tRNAs. (B) An example of CAP-H and SMC2 pulldown enrichment to the input over a tRNA cluster is shown in the UCSC genome browser snapshot. The coordinate is chr16:161,127-179,974 of galGal4. (C) Box plots of SMC2 and CAP-H enrichment to input in tRNA genes with or without overlapping CpG islands (94 and 185 genes, respectively). Both SMC2 and CAP-H enrichments in the tRNA genes with CpG islands are more prominent (average 5.6 and 7.2-fold for SMC2 and CAP-H, respectively) compared to tRNA genes without a CpG island (average about 2-fold for both SMC2 and CAP-H). The difference between these two groups is significant with p-values of 1.2 × 10⁻⁸ for SMC2 and 4.0 × 10⁻¹⁴ for CAP-H (denoted by asterisk) calculated by Wilcoxon Rank Sum test. (D) A bar plot for SMC2 and CAP-H pulldown enrichment to input aligned in the consensus rRNA gene sequences of 28S, 18S, 5.8S, 5S intergenic spacer, and 5S. Significant enrichment of SMC2 and CAP-H relative to input is observed in 28S and 18S rRNA gene sequences having adjusted p-values 7.34 × 10⁻⁴ and 5.99 × 10⁻³, respectively (denoted by asterisk; n=5 as for both SMC2 and CAP-H). Error bars represent standard errors. P-values were calculated using edgeR exact test with Benjamini-Hochberg FDR adjustment .
Figure 3
Figure 3. Condensin I is densely bound at the centromeric sequences in chicken DT40 cells
(A-C) SMC2 and CAP-H pulldown enrichment to the input in the CENP-A associated sequences (centromeres; marked in violet) in (A) chromosome 5, (B) chromosome 27, and (C) chromosome Z of chicken DT40 in a UCSC genome browser view. The coordinates of the known centromeres are chr5:3,075,314-3,104,608 and chr27:4,623-31,524 and chrZ:42,605,339-42,634,855 in galGal4. The centromere sequences are indicated at the top of each genome browser view. (D) Analysis of SMC2 and CAP-H enrichment to input in each consensus centromere repeat sequences derived from the chicken chromosome 1, 2, 3, 4, 7, 8, and 11. Error bars indicate standard errors. P-values were 4.70 × 10⁻³, 4.88 × 10⁻², 1.50 × 10⁻², and 5.99 × 10⁻³ for chromosome 1, 2, 3, and 11 (denoted by asterisk; n=5 as for both SMC2 and CAP-H). P-values were calculated using edgeR exact test with Benjamini-Hochberg FDR adjustment.
Figure 4
Figure 4. Verification of condensin I enrichment using molecular methods in chicken DT40 cells
(A-E) Quantitative PCR was used to validate the selected condensin I enrichment regions including (A) tRNA genes overlapping with CpG islands, (B) tRNA genes without CpG island overlap, (C) CpG islands without tRNA gene overlap, (D) histone genes, and (E) rRNA sequences in the CAP-H pulldown DNA (n=8 for each region; blue). The Y-axis expresses the enrichment changes from input to pulldown of the selected regions relative to that of the control. Eight independent affinity purifications using CAP-H-GFP-SBP were performed and the average quantity was normalized with respect to the control. CAP-H was enriched highly in all these selected regions in the tRNA, 28S and 18S rRNA genes, CpG islands and the histone genes. In contrast, enrichment was not observed in those selected regions in the negative control pulldown from DT40 cells expressing GFP-SBP tag only (n=3 for each region; green), supporting condensin I binding in these regions. The control sequence showed no enrichment for condensin based on our sequencing profiles (chr11:13,498,471-13,498,576 of galGal4), and therefore is not expected to show any enrichment in qPCR. The error bars indicate standard error.
Figure 5
Figure 5. Cytological validation of SMC2 and CAP-H enrichment at telomere repeats
(A) Telomere-FISH (fluorescence in situ hybridization) probes (green) and immunostaining for SMC2 or CAP-H SBP-tagged proteins (red) in both non-stretched and stretched mitotic chromosomes in chicken DT40 cells. DNA is co-stained with DAPI. The overlap of the FISH probe (telomere) and SBP signals (SMC2 or CAP-H) are indicated by a white arrow in both non-stretched (top two panels) and stretched chromosomes (bottom two panels). Their signal is also detected in the centromeric regions (primary constrictions of large chromosomes) in CAP-H-GFP-SBP cells (yellow arrow). (B) An example of chromosome telomere sequences co-localized with condensin I (CAP-H-GFP-SBP) on chromosome 1 that was used for quantification in (C). Note chromosome 1 has prominent interstitial telomere enrichment. Chromosomes were selected that had slightly stretched CAP-H-SBP (red) and therefore discontinuous signal, thereby minimizing the chance of random overlap. For scoring, all seven macro avian chromosomes from interstitial and canonical telomere-CAP-H overlapped regions were analyzed, with both regions showing a very high overlap of CAP-H and telomere signal. The scale bar is 4 μm. (C) Quantification of telomere and CAP-H overlap in mitotic DT40 cells. Approximately 67% of telomere-FISH overlaps with SBP (CAP-H). This contrasts to 31% of SBP occupancy in DNA (representing the chance of SBP overlapping with random DNA). Telomere, CAP-H and DNA signals were calculated from chromosomes from 43 separate cells (n=43). The p-value of 1.29 × 10⁻⁷ is seen using Pearson’s Chi-square test comparing CAP-H and telomere overlap against CAP-H occupancy in the DNA (denoted by asterisk).
Figure 6
Figure 6. Transcriptional analysis of condensin I/CAP-H KO cells
(A) Immunoblotting of CAP-H in CAP-H knockout and wild type DT40 cells with and without doxycycline (dox). RNAs extracted from both CAP-HON and CAP-HOFF interphase synchronized cells using 14 hrs thymidine block were subjected to qRT-PCR analysis. Total time in dox for CAP-HOFF (including 14 hrs thymidine block) was 36 hrs. Immunoblotting analysis shows CAP-H is completely shut down in the knockout cells, whereas, the expression of CAP-H in the wild type was not affected. This is the CAP-H depletion method applied in the qRT-PCR analysis. (B) Experimental design for the analysis, showing that CAP-H KO was dox treated up to 36 hrs including 14 hrs thymidine block. Flow cytometry profiles show that the majority of CAP-H KO cells are in G1 phase after the thymidine-block. Cells were stained in propidium iodide and analyzed by FACS. The CAP-HOFF cells showed virtually no observable segregation defect at harvesting (i.e. post 36 hrs of dox treat). (C) qRT-PCR analysis of CAP-H KO cells. A total of 17 genes including one tRNA gene and six histone genes were selected for analysis based on high condensin I enrichment from our genome-wide ChAP-seq data. CAP-H transcription is also shown in this graph. Overall these genes are down regulated following CAP-H removal. The error bars indicates standard error (n=3).
Figure 7
Figure 7. Distribution density of condensin shapes the metaphase chromosome
The condensin complex (yellow circles) gathers the chromatin into lateral loops (blue) which are centered along a chromatid axis. Chromatin loop size determines the overall width of mitotic chromatids. Large loops are regularly spaced within and between genes to compact most of the genome into sausage-shaped chromatids. At specialized loci such as the centromeres, telomeres and rDNAs, chromatin loops are smaller producing constricted regions.

References

    1. Hirano T. At the heart of the chromosome: SMC proteins in action. Nat Rev Mol Cell Biol. 2006;7:311–322. - PubMed
    1. Saitoh N, Goldberg I, Earnshaw WC. The SMC proteins and the coming of age of the chromosome scaffold hypothesis. Bioessays. 1995;17:759–766. doi:10.1002/bies.950170905. - PubMed
    1. Hirano T. Condensins: universal organizers of chromosomes with diverse functions. Genes & Development. 2012;26:1659–1678. doi:10.1101/gad.194746.112. - PMC - PubMed
    1. Aragon L, Martinez-Perez E, Merkenschlager M. Condensin, cohesin and the control of chromatin states. Curr Opin Genet Dev. 2013 doi:10.1016/j.gde.2012.11.004. - PubMed
    1. Hirano T. Condensins: Organizing and Segregating the Genome. Current Biology. 2005;15:R265–R275. - PubMed

Publication types

MeSH terms