. 2014 Jan;42(1):e3.
doi: 10.1093/nar/gkt878. Epub 2013 Oct 1.

The dynamics of genome replication using deep sequencing

Affiliations

The dynamics of genome replication using deep sequencing

Carolin A Müller et al. Nucleic Acids Res. 2014 Jan.

Abstract

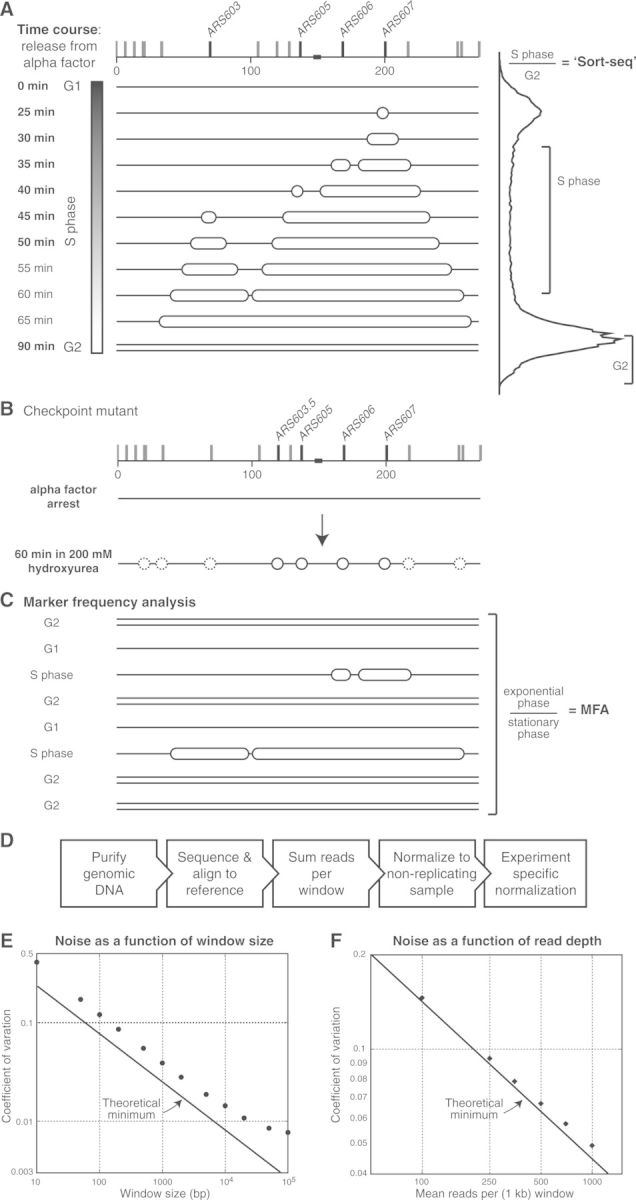
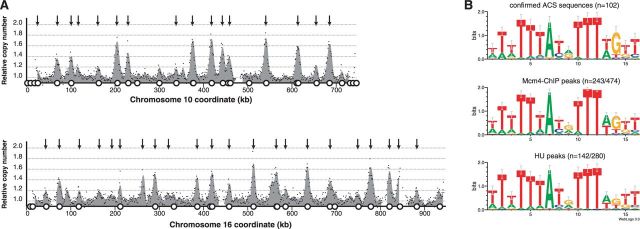
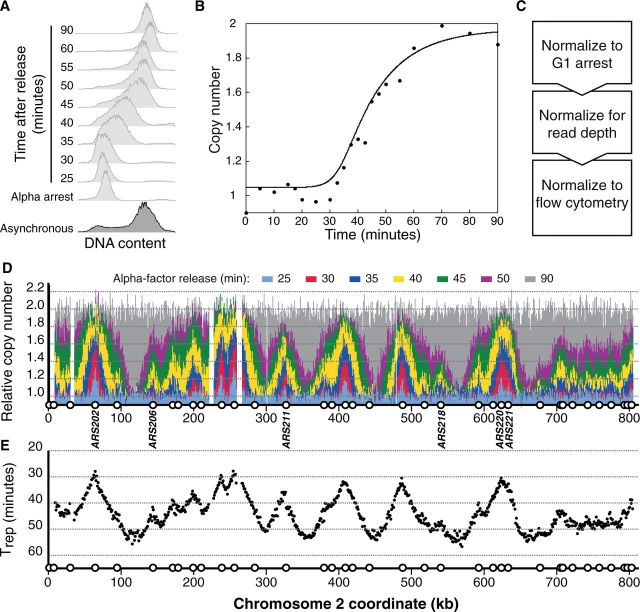
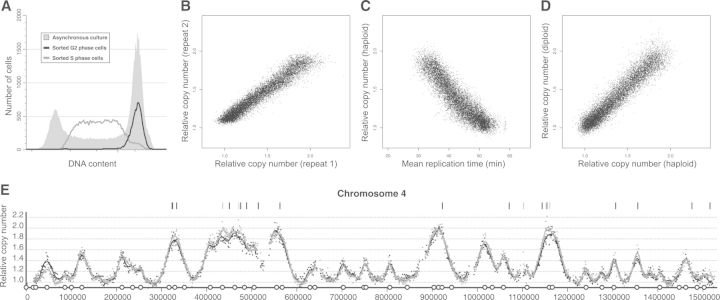
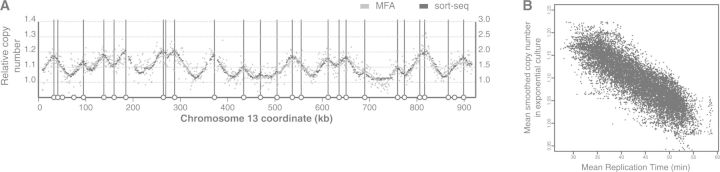
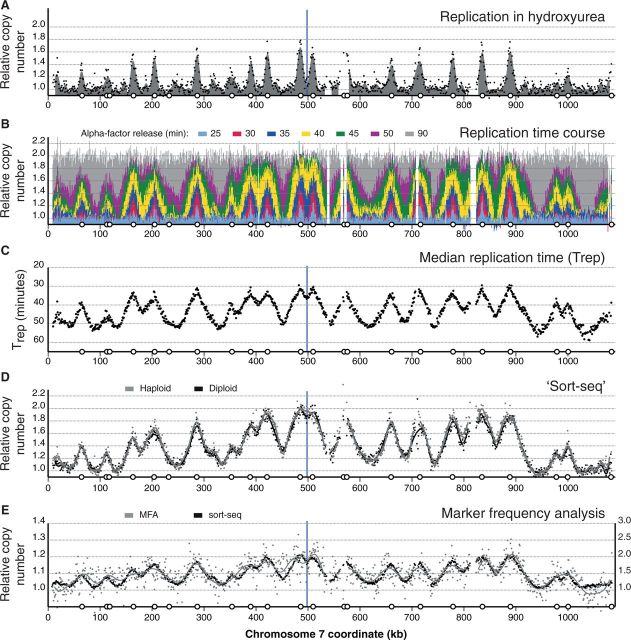
Eukaryotic genomes are replicated from multiple DNA replication origins. We present complementary deep sequencing approaches to measure origin location and activity in Saccharomyces cerevisiae. Measuring the increase in DNA copy number during a synchronous S-phase allowed the precise determination of genome replication. To map origin locations, replication forks were stalled close to their initiation sites; therefore, copy number enrichment was limited to origins. Replication timing profiles were generated from asynchronous cultures using fluorescence-activated cell sorting. Applying this technique we show that the replication profiles of haploid and diploid cells are indistinguishable, indicating that both cell types use the same cohort of origins with the same activities. Finally, increasing sequencing depth allowed the direct measure of replication dynamics from an exponentially growing culture. This is the first time this approach, called marker frequency analysis, has been successfully applied to a eukaryote. These data provide a high-resolution resource and methodological framework for studying genome biology.


Figures

Figure 1.
Figure 1.
Deep sequencing measurements of DNA copy number to determine genome replication dynamics. (A) An overview of two strategies used to investigate genome replication. An example of S. cerevisiae chromosome 6 replication progression (top; replication origins marked by vertical ticks, centromere by box). (Left) Time points analyzed (bold); (right) schematic of flow cytometry profile indicating samples selected for typical sort-seq experiment. (B) Schematic of chromosome replication in checkpoint mutant subjected to replication stress (HU). Solid circles indicate early activating origins, dashed circles later activating origins. (C) MFA allows the measurement of copy number differences from exponential phase cultures (∼25% undergoing DNA replication) relative to stationary phase cultures (no replicating cells). (D) Overview of experimental strategy and data analyses. Relationship between experimental noise (coefficient of variation = standard deviation/mean) and various window sizes (E) and read depths (F). In each case, the points represent experimental values calculated from the sequencing data and the lines represent theoretical minimum values.
Figure 2.
Figure 2.
DNA copy number changes in a checkpoint mutant subjected to HU. (A) DNA copy number increase is restricted to origin proximal regions. The plots show the ratio between uniquely mapped sequencing reads from a G1- and S-phase sample, normalized to a baseline of 1. Regions lacking data are nonunique sequences where reads were not mapped. Black dots are the raw data points in 1 kb windows. Fourier transformation was applied to generate the smoothed profiles, shown in solid gray. Open circles represent known replication origin locations; arrows represent peak calls. The full genome is shown in Supplementary Figure S1. (B) HU peak calls allow rediscovery of the ORC-binding motif, the ACS. Sequence motifs were identified using GIMSAN from experimentally confirmed ACS (top), Mcm4 ChIP-seq peaks (middle) and HU peaks (bottom). The n refers to the number of motif occurrences identified (where appropriate relative to the number of peak calls).
Figure 3.
Figure 3.
Time course analysis of genome replication. (A) Flow cytometry of a culture synchronously released from alpha factor arrest. (B) Quantification (with curve fit) of flow cytometry data for subsequent use in data normalization. (C) Data normalization steps. (D) S. cerevisiae chromosome 2 replication dynamics from seven time points through a synchronous S-phase (each normalized to the alpha factor arrest): 25 (light blue), 30 (red), 35 (blue), 40 (gold), 45 (green), 50 (purple) and 90 min (gray). Open circles represent known replication origin locations with six replication origins (as described in the text) labeled. The full genome is shown in Supplementary Figure S4. (E) Median replication time (Trep), calculated from the time course data. The full genome is shown in Supplementary Figure S5.
Figure 4.
Figure 4.
Sort-seq analysis reveals identical replication dynamics in haploids and diploids. (A) Flow cytometry of an asynchronous diploid S. cerevisiae culture (gray fill) and resulting S-phase enriched cells (gray line) and G2 enriched cells (black line). (B) Comparison of sort-seq from diploid S. cerevisiae for two biological replicates (repeat 1 used SOLiD; repeat 2 used Illumina sequencing). (C) Scatterplot of median replication time (Trep) versus relative copy number from sort-seq for haploid S. cerevisiae. (D) Scatterplot of relative copy number from sort-seq for haploid versus diploid S.cerevisiae. (E) Relative copy number replication profiles from sort-seq for S.cerevisiae chromosome 4. Dots are raw data points in 1 kb windows, and lines show smoothed profiles (black for diploid, gray for haploid). Bars above the profile indicate 1 kb windows that are significantly different (black for P < 0.001; gray for P < 0.01). The full genome is shown in Supplementary Figure S9.
Figure 5.
Figure 5.
Direct measurement of genome replication in exponentially growing cells. (A) MFA as a proxy for replication time. Gray dots are the raw data points (in 1 kb windows), and the line shows the smoothed profile (left y-axis scale). Black dots show relative copy number from the (Illumina) sort-seq experiment (right y-axis scale). Open circles and vertical bars represent known replication origin locations. The full genome is shown in Supplementary Figure S10. (B) Comparison of MFA and median replication time (Trep).
Figure 6.
Figure 6.
Juxtaposition of chromosome 7 data from the four copy number approaches to investigating genome replication. (A) DNA replication in a checkpoint mutant subjected to HU. (B) A time course through a synchronous S-phase (key as in legend to Figure 3). (C) Median replication time (Trep) as calculated from the time course data. (D) Sort-seq to directly compare the replication time of a haploid (gray) and diploid (black). (E) MFA as a proxy for replication time. Open circles represent known replication origin locations; blue bars represent the location of the centromere.

References

    1. Newman TJ, Mamun MA, Nieduszynski CA, Blow JJ. Replisome stall events have shaped the distribution of replication origins in the genomes of yeasts. Nucleic Acids Res. 2013;41:9705–9718. - PMC - PubMed
    1. Mechali M. Eukaryotic DNA replication origins: many choices for appropriate answers. Nat. Rev. Mol. Cell Biol. 2010;11:728–738. - PubMed
    1. Rhind N, Gilbert DM. DNA replication timing. Cold Spring Harb. Perspect. Biol. 2013;5:a010132. - PMC - PubMed
    1. Mechali M, Yoshida K, Coulombe P, Pasero P. Genetic and epigenetic determinants of DNA replication origins, position and activation. Curr. Opin. Genet. Dev. 2013;23:124–131. - PubMed
    1. Knott SR, Peace JM, Ostrow AZ, Gan Y, Rex AE, Viggiani CJ, Tavare S, Aparicio OM. Forkhead transcription factors establish origin timing and long-range clustering in S. cerevisiae. Cell. 2012;148:99–111. - PMC - PubMed

Publication types

MeSH terms

Associated data