

Distinguishing between genotoxic and non-genotoxic hepatocarcinogens by gene expression profiling and bioinformatic pathway analysis
- PMID: 24089152
- PMCID: PMC6505678
- DOI: 10.1038/srep02783
Distinguishing between genotoxic and non-genotoxic hepatocarcinogens by gene expression profiling and bioinformatic pathway analysis
Abstract
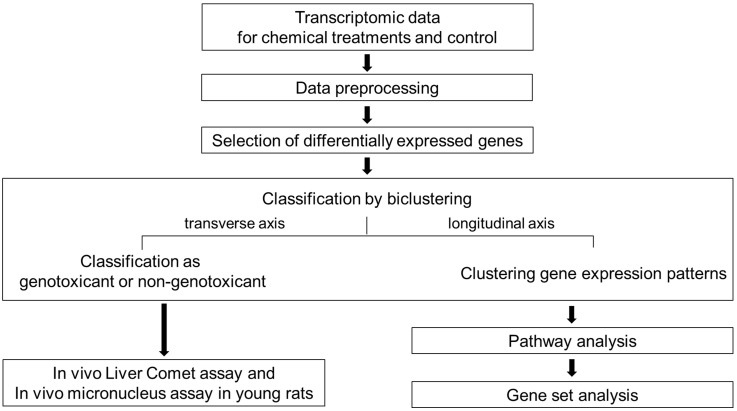
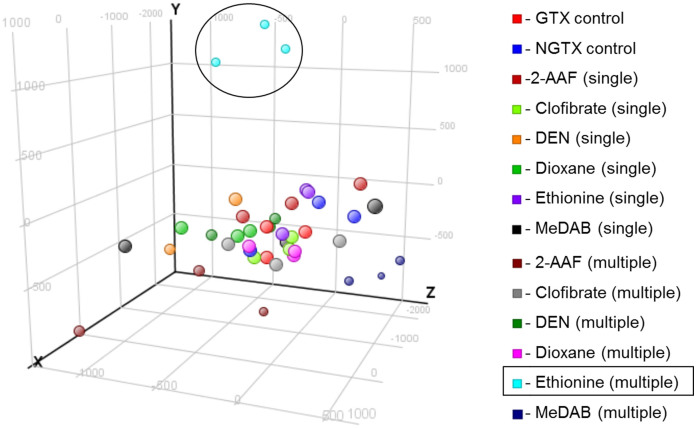
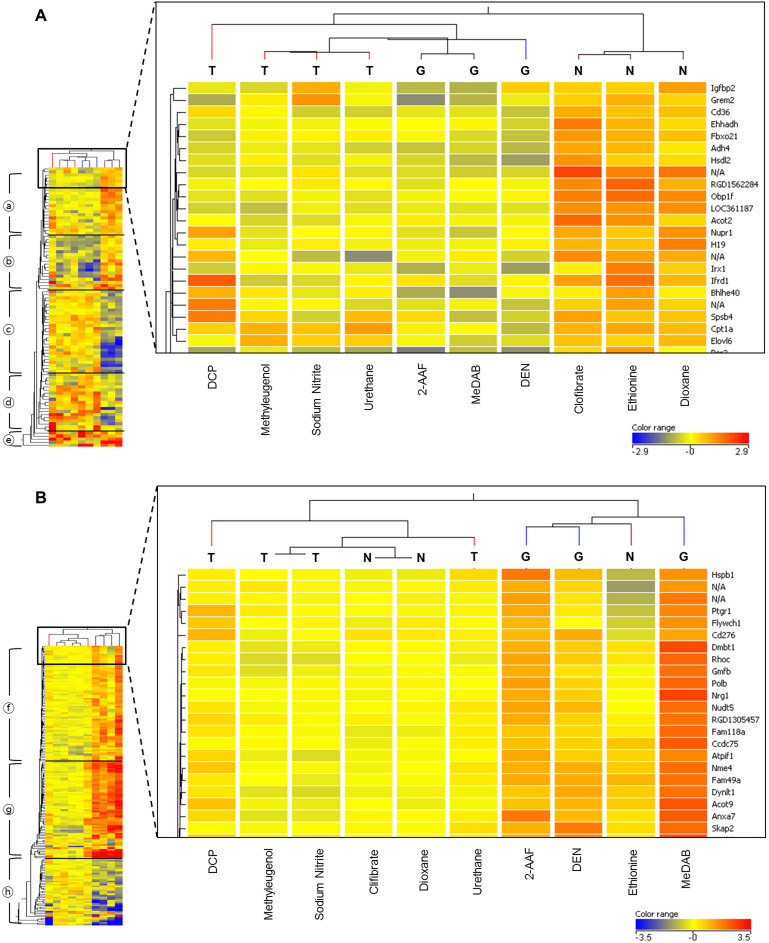
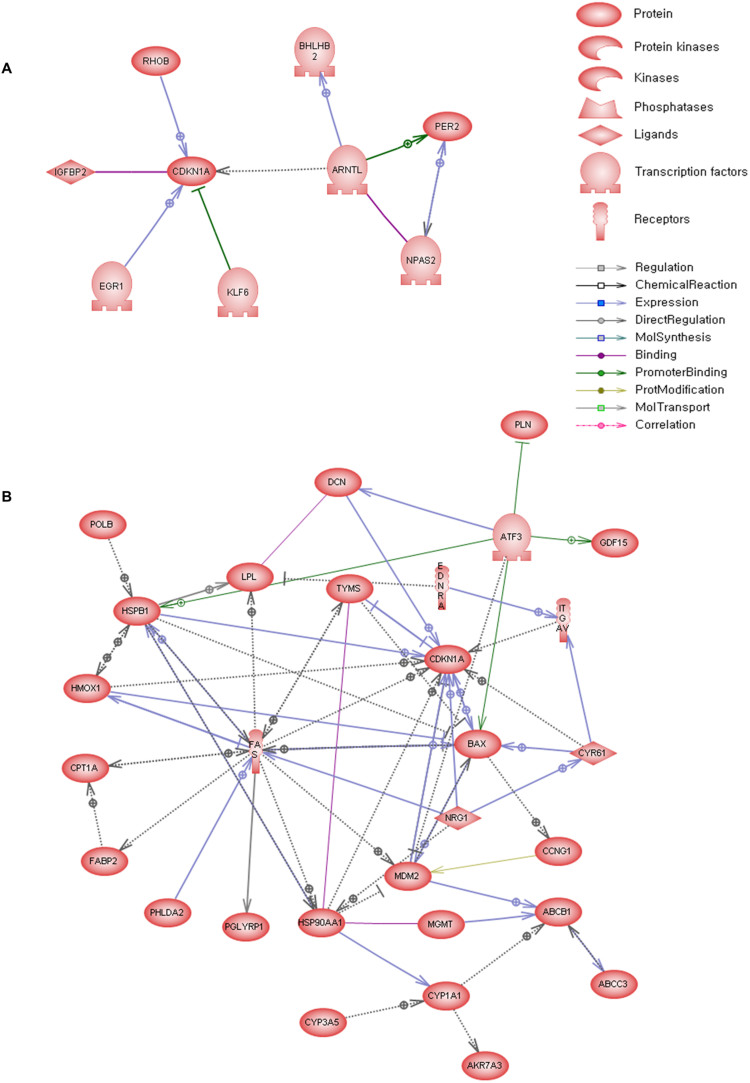
A rapid and sensitive method to determine the characteristics of carcinogens is needed. In this study, we used a microarray-based genomics approach, with a short-term in vivo model, in combination with insights from statistical and mechanistic analyses to determine the characteristics of carcinogens. Carcinogens were evaluated based on the different mechanisms involved in the responses to genotoxic carcinogens and non-genotoxic carcinogens. Gene profiling was performed at two time points after treatment with six training and four test carcinogens. We mapped the DEG (differentially expressed gene)-related pathways to analyze cellular processes, and we discovered significant mechanisms that involve critical cellular components. Classification results were further supported by Comet and Micronucleus assays. Mechanistic studies based on gene expression profiling enhanced our understanding of the characteristics of different carcinogens. Moreover, the efficiency of this study was demonstrated by the short-term nature of the animal experiments that were conducted.
Conflict of interest statement
The authors declare no competing financial interests.
Figures
Similar articles
-
Differential gene expression profiling between genotoxic and non-genotoxic hepatocarcinogens in young rat liver determined by quantitative real-time PCR and principal component analysis.Mutat Res. 2013 Feb 18;751(1):73-83. doi: 10.1016/j.mrgentox.2012.11.003. Epub 2012 Nov 24. Mutat Res. 2013. PMID: 23183053
-
Discrimination of genotoxic and non-genotoxic hepatocarcinogens by statistical analysis based on gene expression profiling in the mouse liver as determined by quantitative real-time PCR.Mutat Res. 2012 Sep 18;747(2):164-75. doi: 10.1016/j.mrgentox.2012.04.011. Epub 2012 May 23. Mutat Res. 2012. PMID: 22634710
-
Comparison of the expression profiles induced by genotoxic and nongenotoxic carcinogens in rat liver.Mutat Res. 2005 Aug 4;575(1-2):61-84. doi: 10.1016/j.mrfmmm.2005.02.004. Mutat Res. 2005. PMID: 15890375
-
Combinations of genotoxic tests for the evaluation of group 1 IARC carcinogens.J Appl Toxicol. 2018 Jan;38(1):81-99. doi: 10.1002/jat.3496. Epub 2017 Jul 11. J Appl Toxicol. 2018. PMID: 28695982 Review.
-
Application of the in vitro rat hepatocyte micronucleus assay in genetic toxicology testing.Mutat Res. 1997 Aug 1;392(1-2):125-38. doi: 10.1016/s0165-1218(97)00051-7. Mutat Res. 1997. PMID: 9269337 Review.
Cited by
-
Non-genotoxic carcinogens (TPA and mezerein) activate tumourous transformation through miR let-7-mediated Hmga2 expression in Bhas42 cells.Environ Epigenet. 2025 Mar 3;11(1):dvaf005. doi: 10.1093/eep/dvaf005. eCollection 2025. Environ Epigenet. 2025. PMID: 40182023 Free PMC article.
-
Penalized negative binomial models for modeling an overdispersed count outcome with a high-dimensional predictor space: Application predicting micronuclei frequency.PLoS One. 2019 Jan 8;14(1):e0209923. doi: 10.1371/journal.pone.0209923. eCollection 2019. PLoS One. 2019. PMID: 30620740 Free PMC article.
-
Paradoxical Behavior of Oncogenes Undermines the Somatic Mutation Theory.Biomolecules. 2022 Apr 30;12(5):662. doi: 10.3390/biom12050662. Biomolecules. 2022. PMID: 35625590 Free PMC article.
-
Dietary phytochemicals as the potential protectors against carcinogenesis and their role in cancer chemoprevention.Clin Exp Med. 2020 May;20(2):173-190. doi: 10.1007/s10238-020-00611-w. Epub 2020 Feb 3. Clin Exp Med. 2020. PMID: 32016615 Review.
-
Gene Expression and Transcriptome Profiling of Changes in a Cancer Cell Line Post-Exposure to Cadmium Telluride Quantum Dots: Possible Implications in Oncogenesis.Dose Response. 2021 Jun 11;19(2):15593258211019880. doi: 10.1177/15593258211019880. eCollection 2021 Apr-Jun. Dose Response. 2021. PMID: 34177396 Free PMC article.
References
-
- Zhao Y., Xie P. & Fan H. Genomic profiling of microRNAs and proteomics reveals an early molecular alteration associated with tumorigenesis induced by MC-LR in mice. Environ Sci Technol 46, 34–41 (2012). - PubMed
-
- Silva Lima B. & Van der Laan J. W. Mechanisms of nongenotoxic carcinogenesis and assessment of the human hazard. Regul Toxicol Pharmacol 32, 135–43 (2000). - PubMed
-
- Ellinger-Ziegelbauer H., Stuart B., Wahle B., Bomann W. & Ahr H. J. Characteristic expression profiles induced by genotoxic carcinogens in rat liver. Toxicol Sci 77, 19–34 (2004). - PubMed
-
- van Delft J. H. et al. Discrimination of genotoxic from non-genotoxic carcinogens by gene expression profiling. Carcinogenesis 25, 1265–76 (2004). - PubMed
Publication types
MeSH terms
Substances
LinkOut - more resources
Full Text Sources
Other Literature Sources
