. 2013 Oct 10;502(7470):194-200.
doi: 10.1038/nature12639. Epub 2013 Oct 2.

Functional interaction between autophagy and ciliogenesis

Affiliations

Functional interaction between autophagy and ciliogenesis

Olatz Pampliega et al. Nature. .

Abstract

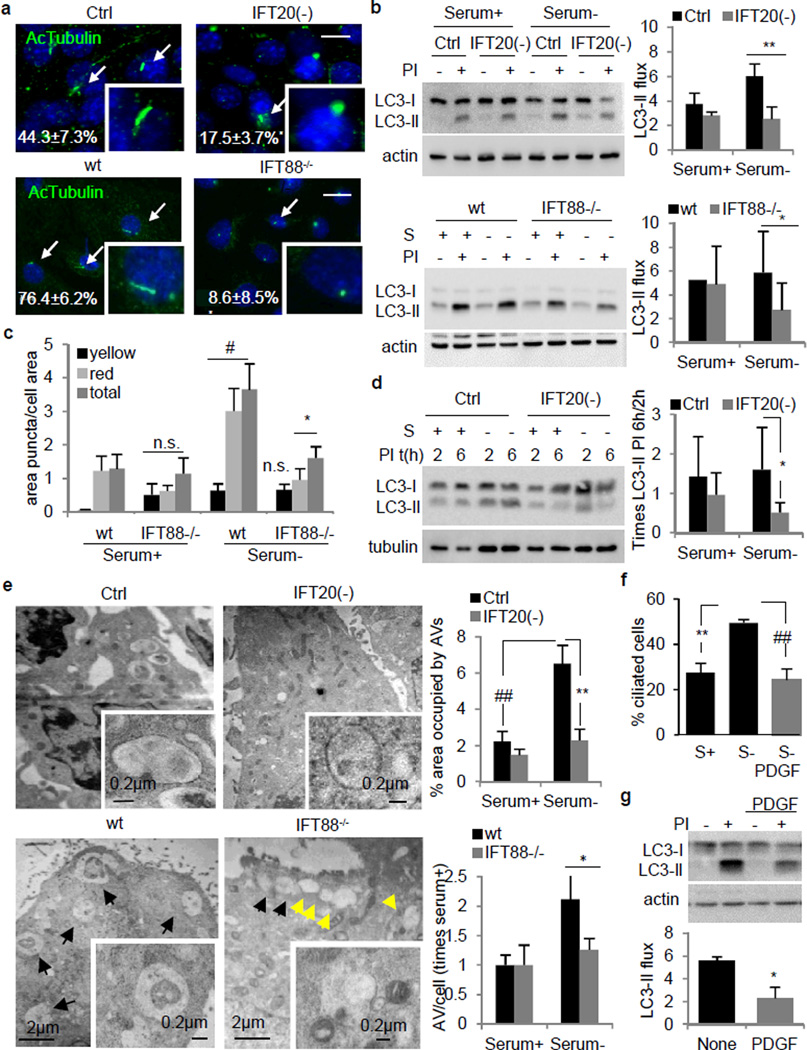
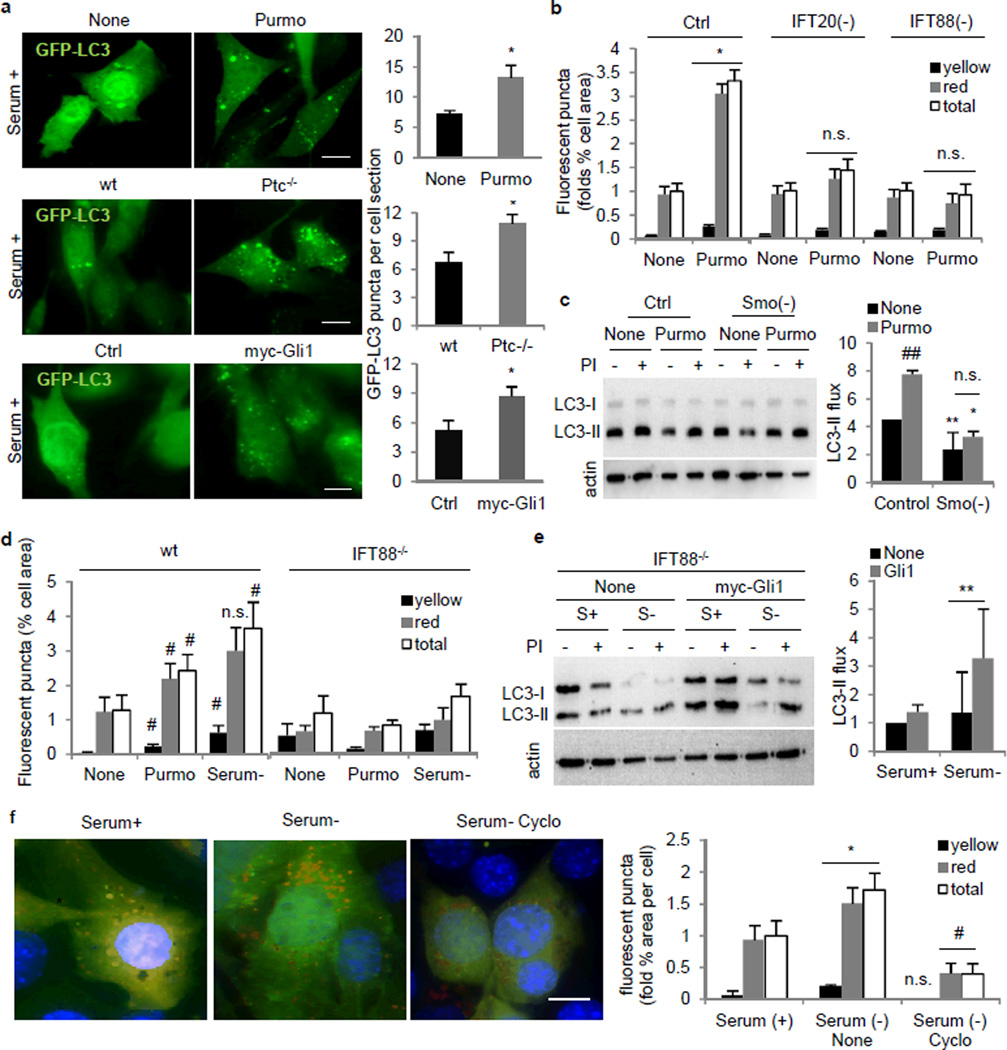
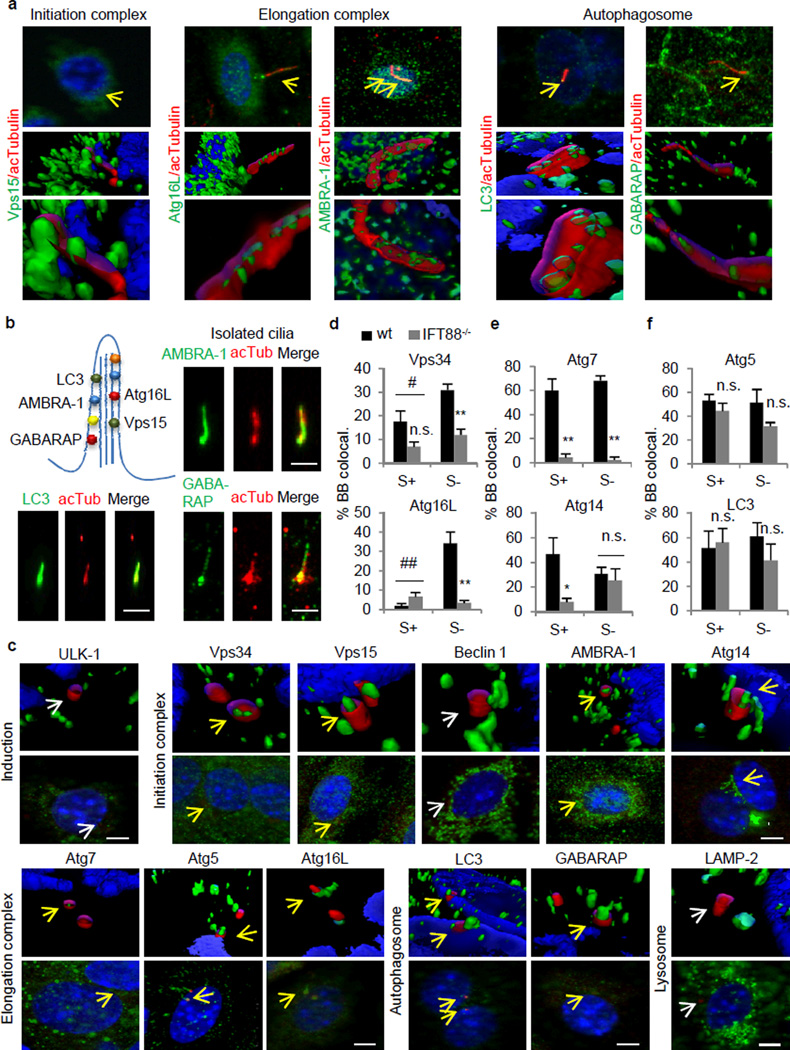
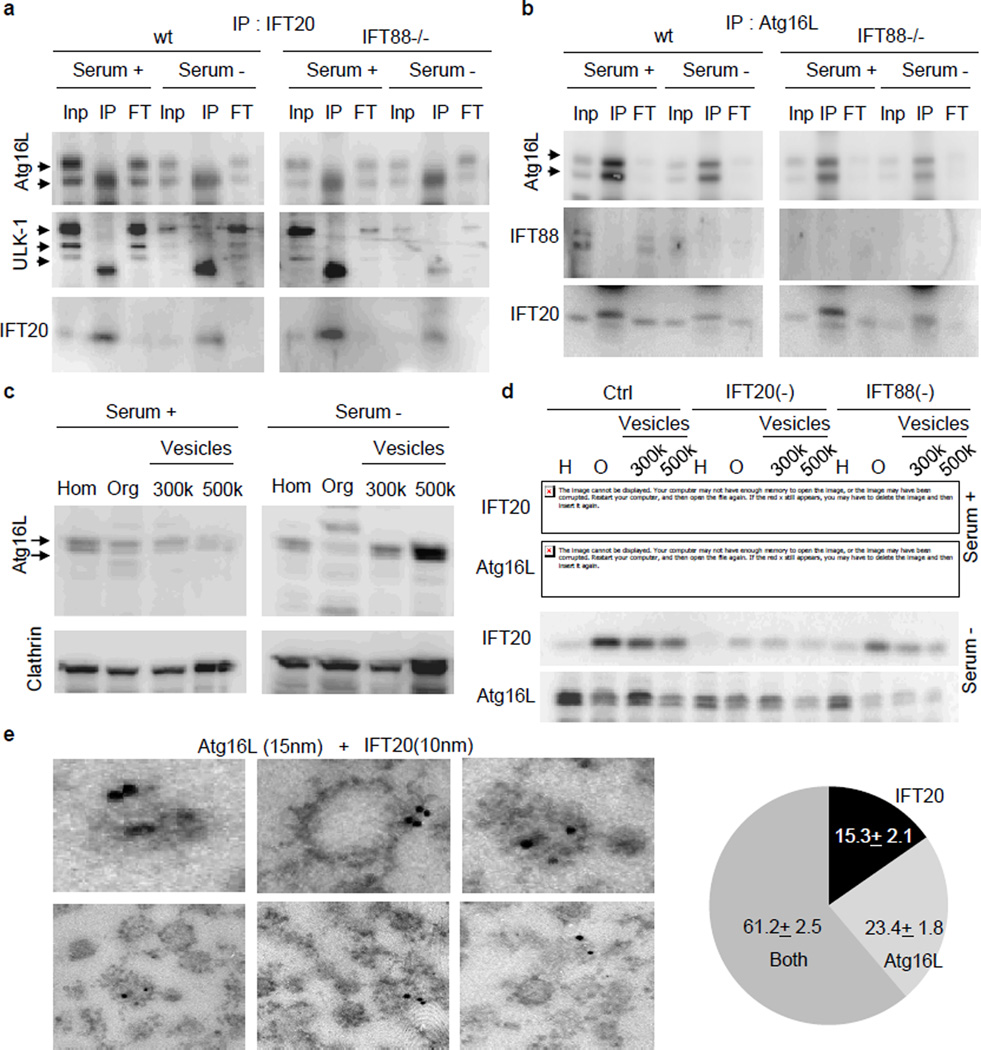
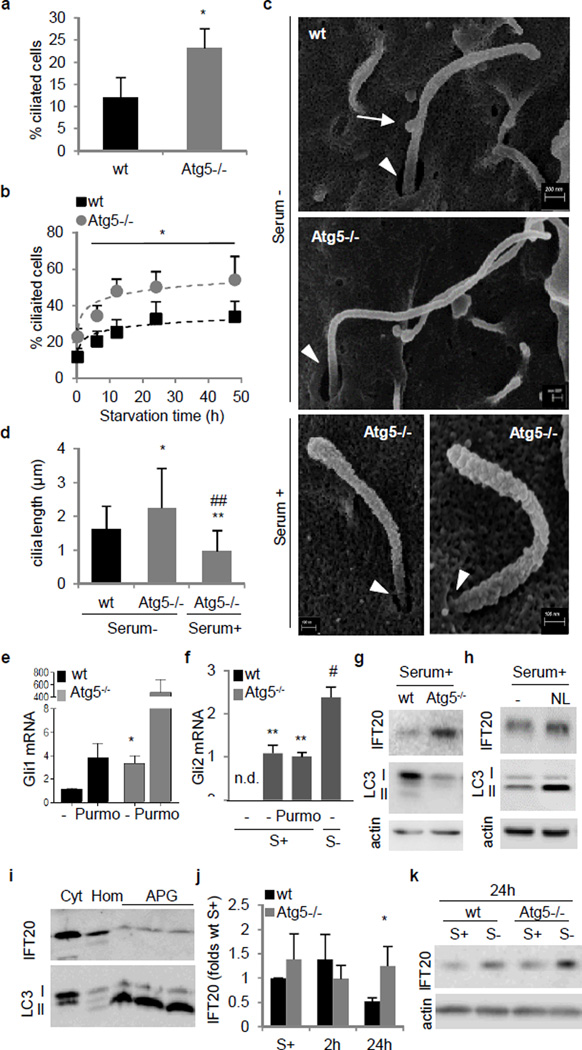
Nutrient deprivation is a stimulus shared by both autophagy and the formation of primary cilia. The recently discovered role of primary cilia in nutrient sensing and signalling motivated us to explore the possible functional interactions between this signalling hub and autophagy. Here we show that part of the molecular machinery involved in ciliogenesis also participates in the early steps of the autophagic process. Signalling from the cilia, such as that from the Hedgehog pathway, induces autophagy by acting directly on essential autophagy-related proteins strategically located in the base of the cilium by ciliary trafficking proteins. Whereas abrogation of ciliogenesis partially inhibits autophagy, blockage of autophagy enhances primary cilia growth and cilia-associated signalling during normal nutritional conditions. We propose that basal autophagy regulates ciliary growth through the degradation of proteins required for intraflagellar transport. Compromised ability to activate the autophagic response may underlie some common ciliopathies.


Figures

Figure 1
Figure 1. Blockage of IFT reduces autophagic activity
(a) Ciliated control and IFT20(−) MEFs (*p=0.030, n=3), and wt and IFT88−/− KECs (**p=0.003, 25 cell each, n=3). Arrows: cilia. (b) LC3 flux. Ctrl and IFT20(−) MEFs (**p=0.0003, n=7). Wt and IFT88−/− KECs (*p=0.035, n=9). (c) Autophagic flux by mCherry-GFP-LC3. Puncta: Yellow, autophagosomes; red autophagolysosomes; total, both together (#p=0.008, *p=0.025). (d) Autophagosome formation. S: serum; PI: protease inhibitors (*p=0.048, n=4). (e) Electron microscopy and quantification of autophagic vacuoles (AV) in Ctrl and IFT20(−) MEFs (##p=0.001, **p=0.001, 10 fields in 2 experiments) and KECs wt and IFT88−/− (*p=0.037, 5 fields). Arrows: AV (black) and endosomal compartments (yellow). (f) Ciliated MEFs after 50ng/ml PDGF. (**p=0.001, ##p=0.0009, 121, 230 and 162 cells, n=5). (g) LC3 flux upon PDGF (*p=0.005, n=3). Bars: 10µm. n.s., statistically non-significant. Mean±s.d. in b, d and mean±s.e.m rest.
Figure 2
Figure 2. Hedgehog signaling requires the primary cilia to regulate autophagy
(a) GFP-LC3 in MEFs with Purmorphamine (Purmo; *p=0.028, n=4), Ptc−/− (*p=0.015, n=4) and myc-Gli1 overexpression (*p=0.012, n=3). (b) mCherry-GFP-LC3 upon Purmo treatment in MEFs. Yellow, autophagosomes; red, autophagolysosomes; total, both. (*p=0.0323, 40 fields). (c) LC3 flux in Ctrl (**p=0.001) and Smo(−) MEFs (**p=0.0001) upon Purmo (*p=0.009). (n=4). (d) mCherry-GFP-LC3 in wt and IFT88−/− KECs upon Purmo. (wt Purmo, #p=0.046; wt Serum-, #p=0.008, 40 fields). (e) LC3 flux in IFT88−/− KECs overexpressing myc-Gli1 (**p=0.00006, n=3). (f) mCherry-GFP-LC3 in MEFs with Cyclopamine (Cyclo). (*p=0.011, #p=0.013, 25 fields). Bars: 10µm. n.s., statistically non-significant. Mean±s.d in c, f and mean±s.e.m rest.
Figure 3
Figure 3. Autophagy-related proteins associate with ciliary structures in a serum-dependent manner
(a) Co-immunostaining and 3D reconstruction for Atgs (green) and acetylated tubulin (red). Yellow arrows: colocalization. (b) Atgs associated with the axoneme. Co-immunostaining for Atgs and acetylated tubulin in isolated cilia. (c) Co-immunostaining and 3D reconstruction for Atgs (green) and gamma tubulin (red). Arrows: colocalization (yellow), no colocalization (white). (d–f) Cells with colocalizing Atgs in the basal body (BB). (d) Serum- and IFT-dependent (Vps34, #p=0.04, **p=0.002, n=4; Atg16L, ##p=0.0003, **p=0.0009, 15 cells each per experiment, n=7), (e) IFT-dependent but serum-independent (Atg7, S+ **p=0.001, S− **p= 9.33768E-06, n=4; Atg14, *p=0.018, 15 cells each per experiment, n=5), and (f) BB association independent on serum or IFT (Atg5, n=5; LC3, n=8; 15 cells each per experiment). Bars: 10µm. n.s., statistically non-significant. Mean±s.e.m.
Figure 4
Figure 4. IFT20 regulates trafficking of Atg16L to the cilium
(a,b) Reciprocal co-immunoprecipitation of IFT20 (a) and Atg16L (b). Inp: 1/10 input; IP: immunoprecipitate; FT: 1/10 flow-through. (c) Immunoblot for Atg16L and Clathrin in MEFs homogenate (Hom), and the pellets from 1h centrifugation at 100,000 g (organelles (Org)), 300,000 g and 500,000 g (Vesicles). (d) Immunoblot for IFT20 and Atg16L in the same fractions isolated from Ctrl, IFT20(−) and IFT88 (−) MEFs. (e) Immunogold electron microscopy for Atg16L (15nm particles) and IFT20 (10nm particles) in isolated vesicles from MEFs. Bottom: IFT20 and Atg16L presence in the vesicles (11 fields). Mean±s.e.m.
Figure 5
Figure 5. Ciliogenesis is enhanced in autophagy-defective cells
(a,b) Ciliated Atg5−/− MEFs in serum+ (*p=0.038, 25 cells each per experiment, n=3) (a) or serum− (*p=0.006, non-linear fit regression, 25 cells each per experiment, n=3) (b). (c) Scanning electron microscopy (SEM) of primary cilia. Arrows: cilia-associated vesicles. Arrowheads: ciliary pocket. (d) Cilia length quantification from SEM (*p=0.027 n=28; **p=0.001, ##p=0.0001, n=23). (e,f) Gli1 (*p=0.04, n=3) (e) and Gli2 (S+ **p=0.0005, S+ Purmo **p=0.0046, S− #p=0.0132, n=3) (f) mRNA expression in Atg5−/− MEFs. (g,h) IFT20 immunoblot in Atg5−/− (g) and wt MEFs with lysosomal inhibitors (NL) (h). (i) IFT20 immunoblot in cytosol (Cyt), homogenate (Hom) and autophagosomes (APG). (j) IFT20 protein levels in Atg5−/− MEFs (*p=0.038, n=6). (k) IFT20 immunoblot in Atg5−/− MEFs. n.s., statistically non-significant. Mean±s.d. in d and j, Mean±s.e.m rest.

Comment in

Similar articles

Cited by

References

    1. Mizushima N, Levine B, Cuervo AM, Klionsky DJ. Autophagy fights disease through cellular self-digestion. Nature. 2008;451:1069–1075. - PMC - PubMed
    1. Hamasaki M, Shibutani ST, Yoshimori T. Up-to-date membrane biogenesis in the autophagosome formation. Curr Opin Cell Biol. 2013;25:455–460. - PubMed
    1. Yang Z, Klionsky DJ. Mammalian autophagy: core molecular machinery and signaling regulation. Curr Opin Cell Biol. 2010;22:124–131. - PMC - PubMed
    1. Satir P, Pedersen LB, Christensen ST. The primary cilium at a glance. J Cell Sci. 2010;123:499–503. - PMC - PubMed
    1. Taschner M, Bhogaraju S, Lorentzen E. Architecture and function of IFT complex proteins in ciliogenesis. Differentiation. 2012;83:S12–S22. - PMC - PubMed

Publication types