

Positional information, in bits
- PMID: 24089448
- PMCID: PMC3799327
- DOI: 10.1073/pnas.1315642110
Positional information, in bits
Abstract
Cells in a developing embryo have no direct way of "measuring" their physical position. Through a variety of processes, however, the expression levels of multiple genes come to be correlated with position, and these expression levels thus form a code for "positional information." We show how to measure this information, in bits, using the gap genes in the Drosophila embryo as an example. Individual genes carry nearly two bits of information, twice as much as would be expected if the expression patterns consisted only of on/off domains separated by sharp boundaries. Taken together, four gap genes carry enough information to define a cell's location with an error bar of ~1 along the anterior/posterior axis of the embryo. This precision is nearly enough for each cell to have a unique identity, which is the maximum information the system can use, and is nearly constant along the length of the embryo. We argue that this constancy is a signature of optimality in the transmission of information from primary morphogen inputs to the output of the gap gene network.
Keywords: embryonic development; gene regulatory networks; optimization.
Conflict of interest statement
The authors declare no conflict of interest.
Figures
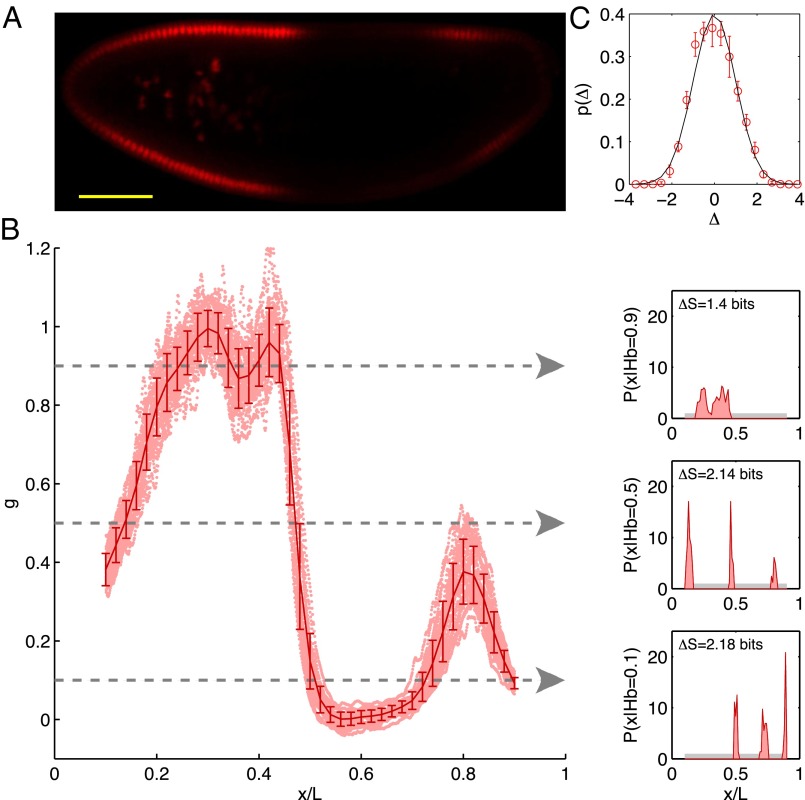
 .) (B) Normalized dorsal profiles of fluorescence intensity, which we identify as Hb expression level g, from 24 embryos (light red dots) selected in a 38- to 48-min time interval after the beginning of nuclear cycle 14. Position x along the anterior/posterior axis is normalized by the length L of the embryo;
  corresponds to the anterior end of the embryo, and
  corresponds to the posterior end. Means
  and SDs
  are plotted in darker red. Considering all points with g = 0.1, 0.5, or 0.9 (Left), yields the conditional distributions with probability densities
  (Right). Note that these distributions are much more sharply concentrated than the uniform distribution
  shown in light gray; correspondingly, the entropies
  are very much smaller than the entropy
  . For each g, we note the reduction of uncertainty in x by reading out g,
  . (C) Variations in expression level around the mean at each position, estimated by the distribution of normalized relative expression, given by
  (red circles with SEMs). The solid line is a zero mean/unit variance Gaussian.
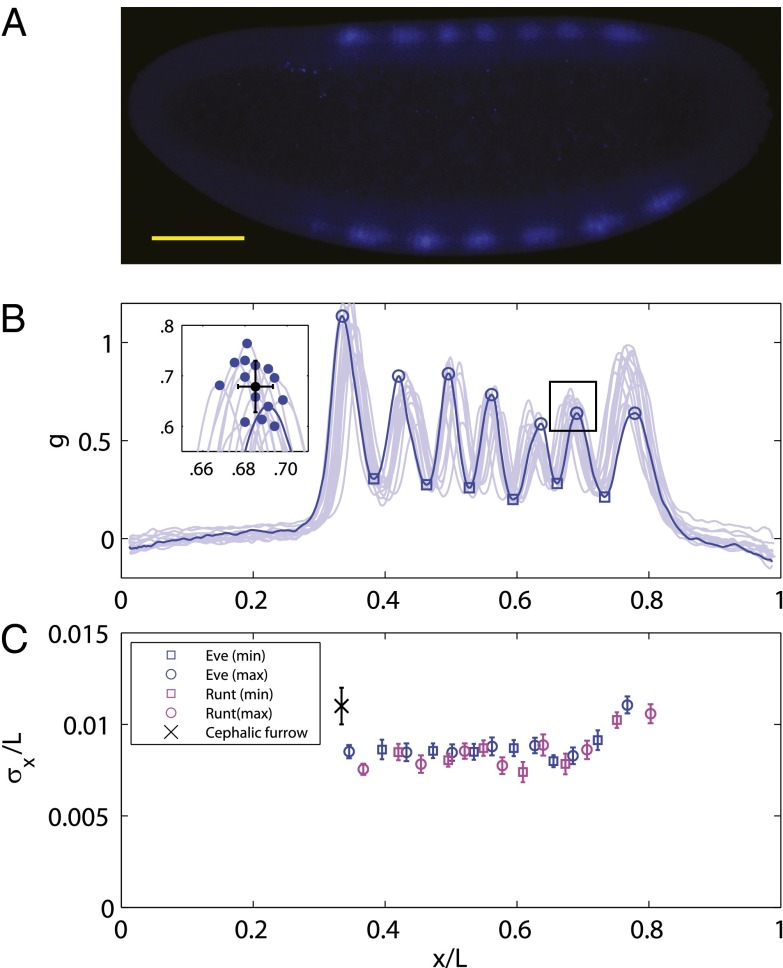
 .) (B) Normalized dorsal profiles of fluorescence intensity from 12 embryos selected in a 45- to 55-min time window after the beginning of nuclear cycle 14 (light blue lines); the dorsal profile of the top panel embryo is shown in darker blue. (Inset) Zooming in on a single peak, we can measure the SD of both the expression level and position of this element in the pattern. (C) Summary of results from such measurements on Eve (blue) and Runt (magenta), plotting the SD of the position
  as a function of the mean position
  , together with a similar measurement on the reproducibility of the cephalic furrow (33). Note that all the elements are positioned with 1% accuracy or better.
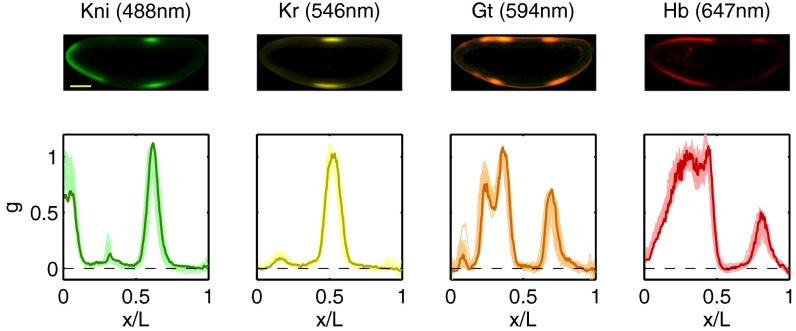
 .) (Lower) Normalized expression levels along the dorsal edge for 24 embryos in a 38- to 48-min time interval after the start of nuclear cycle 14 (light colors); the sample embryo is highlighted (dark colors).
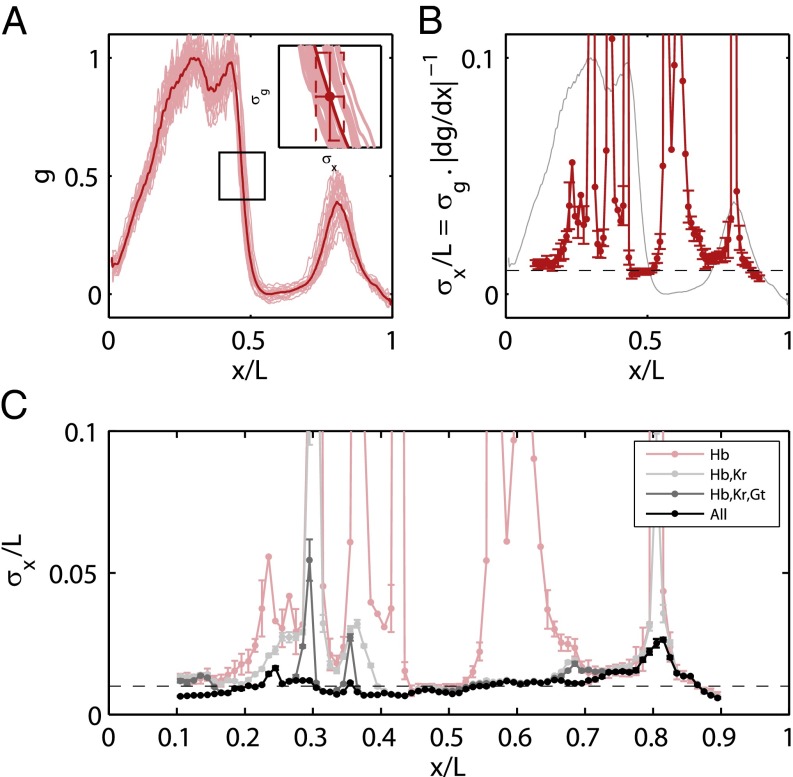
 is proportional to the reproducibility of the profiles and is inversely proportional to the derivative of the mean profile. (B) Positional error based on the expression of Hb alone (red; mean ± SEM from bootstrapping) compared with the mean profile (gray). (C) Positional error based on combinations of gap genes, from Eq. 11. Note that once we combine information from all the gap genes, the net positional error is nearly constant and equal to 1% along the entire anterior/posterior axis.
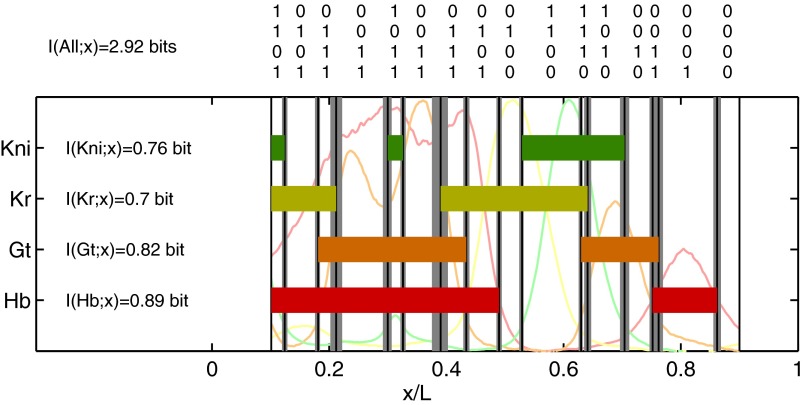
 is greater than a threshold
  and off (0) otherwise. Here, we show the resulting domains of gene expression (dark color bars), as well as the fluctuations of their borders (in gray) for a set of thresholds that maximizes the total information carried by the binary variables (
 ,
,  ,
,  ,
,  ). For reference, the mean profiles are plotted in dim colors in the background. (Left) Information carried by the quantized profiles of the individual genes is shown. The joint pattern of gap gene activity at each position is represented by a four-digit binary code (shown above, with the bits representing Kni, Kr, Gt, and Hb from top to bottom), and the total information encoded jointly by the on/off variables is computed as explained in the main text.
References
-
- Wolpert L. Positional information and the spatial pattern of cellular differentiation. J Theor Biol. 1969;25(1):1–47. - PubMed
-
- Nüsslein-Volhard C, Wieschaus E. Mutations affecting segment number and polarity in Drosophila. Nature. 1980;287(5785):795–801. - PubMed
-
- Lawrence PA. The Making of a Fly: The Genetics of Animal Design. Oxford: Blackwell; 1992.
-
- Elowitz MB, Levine AJ, Siggia ED, Swain PS. Stochastic gene expression in a single cell. Science. 2002;297(5584):1183–1186. - PubMed
-
- Ozbudak EM, Thattai M, Kurtser I, Grossman AD, van Oudenaarden A. Regulation of noise in the expression of a single gene. Nat Genet. 2002;31(1):69–73. - PubMed
Publication types
MeSH terms
Substances
Grants and funding
LinkOut - more resources
Full Text Sources
Other Literature Sources
Molecular Biology Databases
Miscellaneous
