. 2013 Oct 2;33(40):15735-46.
doi: 10.1523/JNEUROSCI.1939-13.2013.

Filamin A regulates neuronal migration through brefeldin A-inhibited guanine exchange factor 2-dependent Arf1 activation

Affiliations

Filamin A regulates neuronal migration through brefeldin A-inhibited guanine exchange factor 2-dependent Arf1 activation

Jingping Zhang et al. J Neurosci. .

Abstract

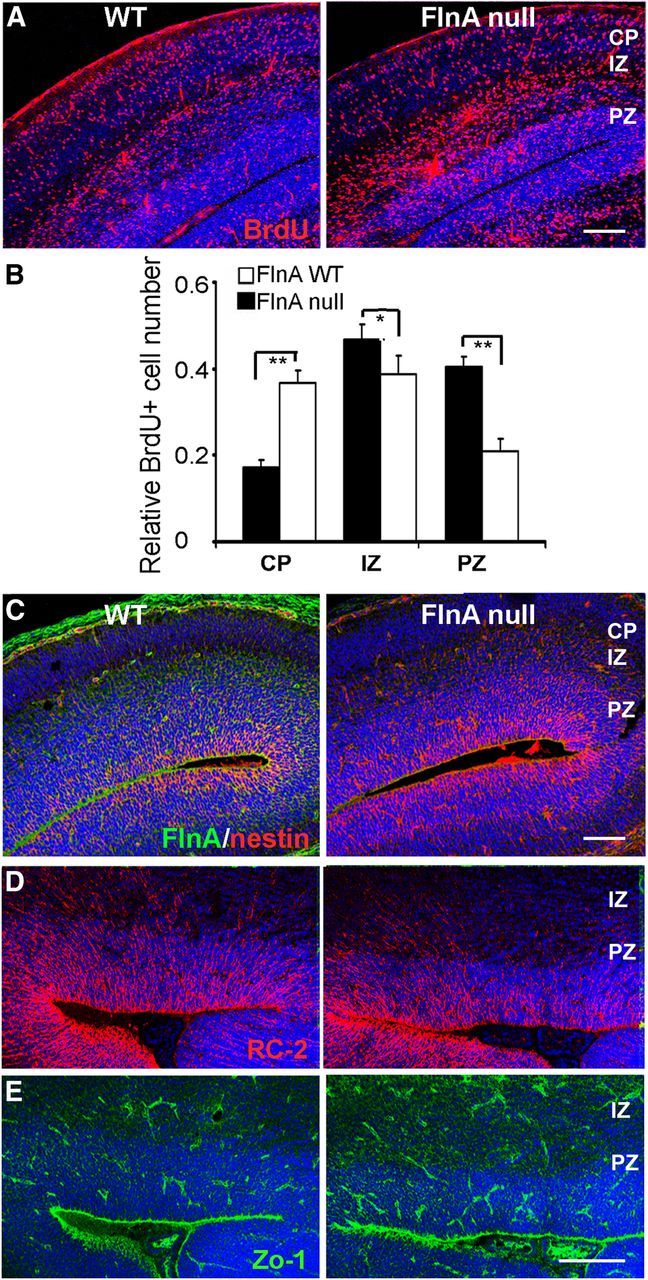
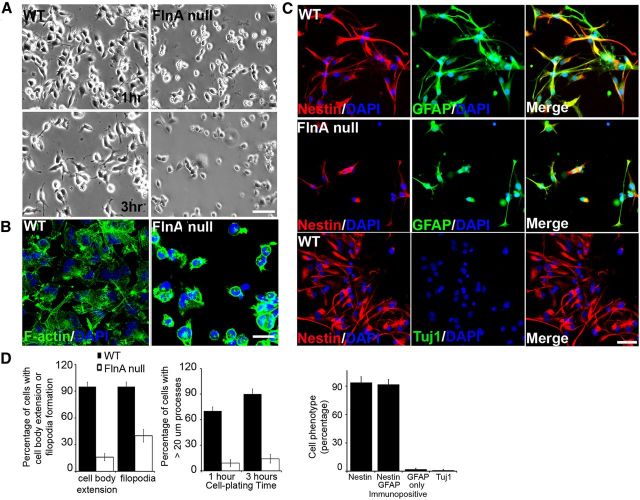
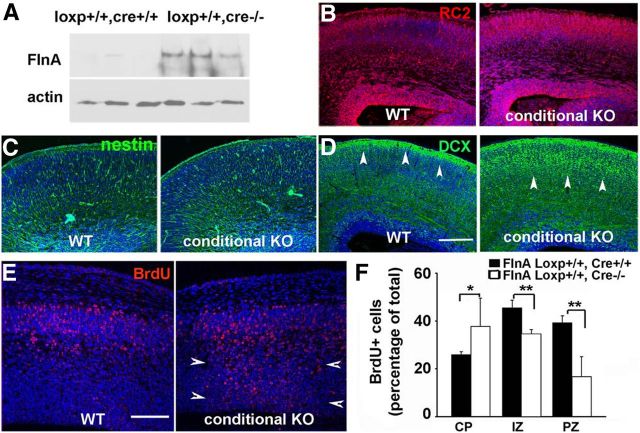
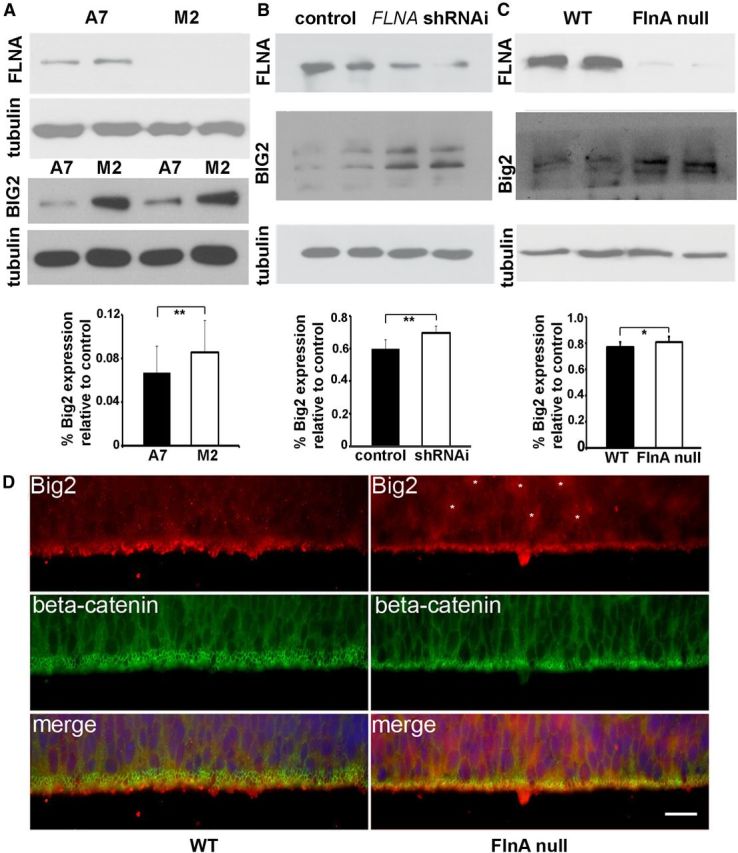
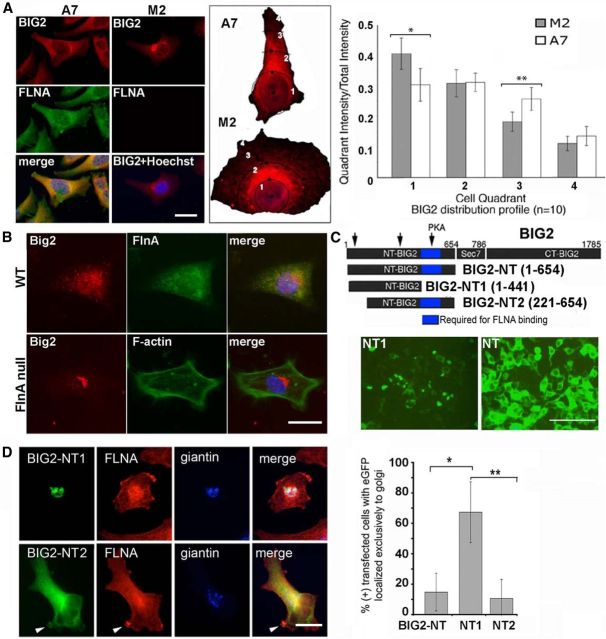
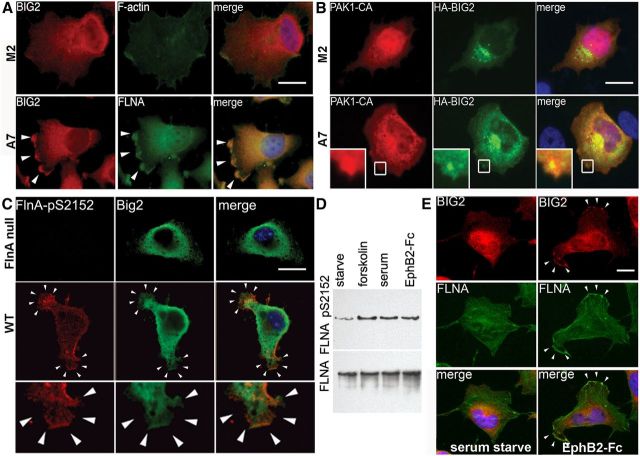
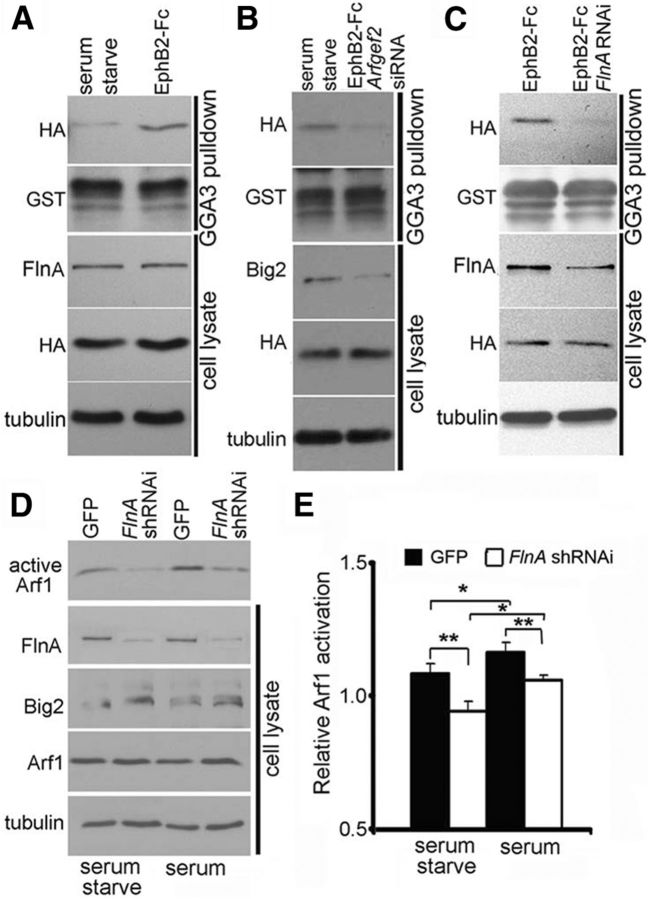
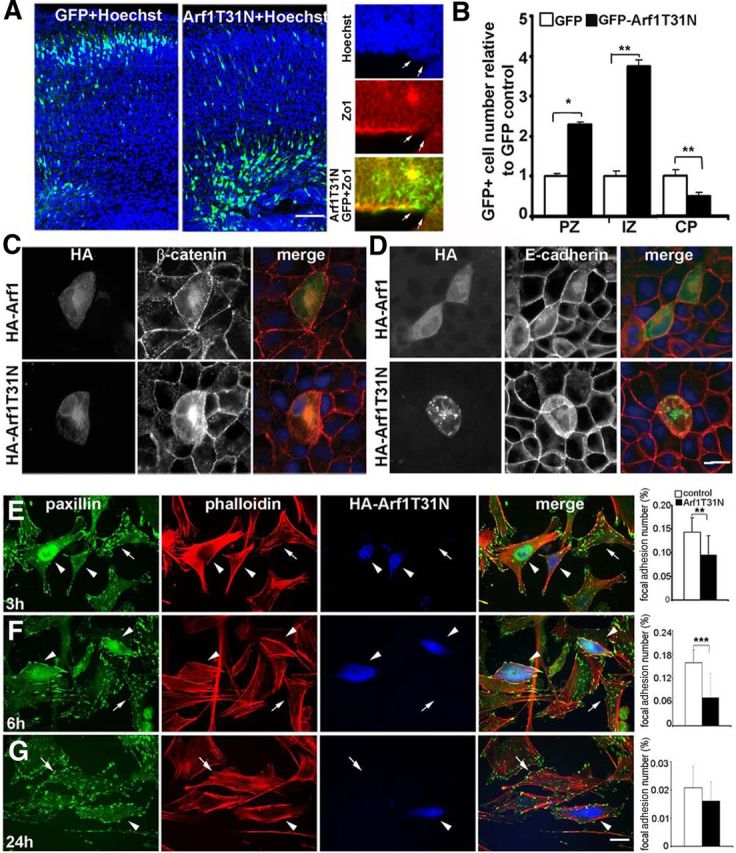
Periventricular heterotopias is a malformation of cortical development, characterized by ectopic neuronal nodules around ventricle lining and caused by an initial migration defect during early brain development. Human mutations in the Filamin A (FLNA) and ADP-ribosylation factor guanine exchange factor 2 [ARFGEF2; encoding brefeldin-A-inhibited guanine exchange factor-2 (BIG2)] genes give rise to this disorder. Previously, we have reported that Big2 inhibition impairs neuronal migration and binds to FlnA, and its loss promotes FlnA phosphorylation. FlnA phosphorylation dictates FlnA-actin binding affinity and consequently alters focal adhesion size and number to effect neuronal migration. Here we show that FlnA loss similarly impairs migration, reciprocally enhances Big2 expression, but also alters Big2 subcellular localization in both null and conditional FlnA mice. FlnA phosphorylation promotes relocalization of Big2 from the Golgi toward the lipid ruffles, thereby activating Big2-dependent Arf1 at the cell membrane. Loss of FlnA phosphorylation or Big2 function impairs Arf1-dependent vesicle trafficking at the periphery, and Arf1 is required for maintenance of cell-cell junction connectivity and focal adhesion assembly. Loss of Arf1 activity disrupts neuronal migration and cell adhesion. Collectively, these studies demonstrate a potential mechanism whereby coordinated interactions between actin (through FlnA) and vesicle trafficking (through Big2-Arf) direct the assembly and disassembly of membrane protein complexes required for neuronal migration and neuroependymal integrity.


Figures

Figure 1.
Figure 1.
Loss of FlnA impairs neural progenitor migration. A, B, Fluorescent photomicrographs demonstrate a greater number of BrdU-positive cells residing in the ventricular and subventricular zones of the cerebral cortex of E17.5 null FlnA mice (72 h after pulsed BrdU administration) compared with WT control, indicative of an impairment in neuronal migration. Quantitative analyses of the relative number of BrdU-positive cells in the CP, IZ, and PZ for both WT and null FlnA mice are provided graphically in B (n = 3 for either sex of embryos). *p < 0.5, **p < 0.05. C–E, Fluorescent photomicrograph demonstrates no significant difference in immunostaining for radial glial markers, nestin, RC2, and Zo-1, between WT and FlnA-null brain tissues at E15.5, suggesting that the altered migration is not due to some disruption in the neuroependymal lining or radial glial scaffolding. Scale bars: A, C, top, 100 μm; D, E, 150 μm.
Figure 2.
Figure 2.
Impairment in progenitor attachment and filopodia extension. A, Images taken under bright-field microscopy show FlnA WT neural progenitors attachment and process extension 1–3 h after plating onto laminin-coated coverslips. In contrast, null FlnA progenitors adopt a rounded morphology and more limited process extension at comparable time points (n = 3 triplicate individual experiments). B, Fluorescent photomicrographs taken under fluorescein show phalloidin-labeled actin stress fibers in both null and FlnA E13.5 neural progenitors, 1 h after plating. WT progenitors show extension of filopodia, required for neural migration, whereas progenitors lacking FlnA fail to extend appropriate projections on laminin-coated coverslips. C, E13.5 neural progenitors uniformly immunostain for the progenitor markers nestin (rhodamine) and GFAP (fluorescein), but not Tuj1, suggesting that the migratory neural population can be affected at an early stage of neuronal progenitor development. D, Summary of findings in A–C are graphically summarized from n > 3 independent experiments per variable. Scale bars: A, 100 μm; B, 20 μm; C, 40 μm.
Figure 3.
Figure 3.
Neuronal migration defect following acute loss of FlnA function. A, Western blot shows the near absence of FlnA protein expression in tamoxifen-treated FlnA loxp mice crossbred with tamoxifen-inducible Cre mice. Pregnant dams were administered tamoxifen at E11.5 for 3 d and killed at E17.5 (n = 3 individuals). B, C, Fluorescent photomicrographs show no significant differences by immunostaining for the radial glial markers RC2 and nestin between FlnA WT and conditional KO mice. As with the straight FlnA-null mice, there is no suggestion of disruption in the neuroependyma or radial glial scaffolding to account for any migration defect at this age. D, Fluorescent photomicrographs demonstrate more diffuse staining across the cortical width (arrowheads) for the early postmitotic neuronal marker DCX in the conditional KO vs WT mouse, consistent with a neuronal migration problem. E, Similarly, fluorescent photomicrographs demonstrate a greater proportion of BrdU-positive cells (BrdU pulse performed at E13.5) in the PZ and IZ of the conditional FlnA CKO mice (arrowheads) compared with WT embryonic brain at E15.5. F, The relative distribution of BrdU-positive cells in the WT and CKO FlnA in the CP, IZ, and PZ is graphically shown (n = 4 for either sex of embryos, six sections for each mouse were quantified; *p < 0.5, **p < 0.05). Scale bars: B, C, D, 150 μm; E, 200 μm.
Figure 4.
Figure 4.
FlnA regulates Big2 expression. A, Western blot shows increased BIG2 protein levels in FLNA-deficient M2 cells compared with FLNA-replete A7 cells. B, Similarly, BIG2 levels are elevated by Western blot following FlnA knockdown by shRNAi in stably transfected Neuro2A neuroblastoma cells. C, Last, enhanced Big2 expression is found in FlnA-null progenitor cells compared with FlnA WT cells. Tubulin is used as a loading control. D, Fluorescent photomicrograph shows an overall increase in Big2 immunostaining (asterisks) in null FlnA ventricular zone. Scale bar, 20 μm.
Figure 5.
Figure 5.
FlnA regulates Big2 subcellular localization. A, Fluorescent photomicrograph demonstrates BIG2 expression primarily resides in the cell cytoplasm in serum-starved FLNA-replete A7. In serum-starved FLNA-deficient M2 cells, BIG2 expression is generally restricted to the Golgi or perinuclear region. To quantify BIG2 distribution, M2 and A7 cell bodies are divided into four radial quadrants spanning from the nucleus to the cell periphery. The adjacent graph displays the relative BIG2 immunostaining intensity (quadrant intensity/total cellular intensity) for each quadrant in M2 and A7 cells. The relative BIG2 immunostaining intensity in A7 cells is significantly smaller than M2 cells in quadrant 1 (n = 10, *p = 0.00394) and is significantly larger than M2 cells in quadrant 3 (n = 10, **p = 0.001825), indicative of cytoplasmic versus perinuclear BIG2 localization in the presence of FLNA. B, Similarly, the fluorescent photomicrograph demonstrates Big2-dispersed localization in the cytoplasm of FlnA WT neural progenitor cells, as opposed to a perinuclear distribution in FlnA-null progenitors. C, Schematic displays of various fragments along the N-terminal region of BIG2, which either are missing BIG2-NT1 (amino acids 1–441) or contain BIG2-NT2 (amino acids 221–654) and BIG2 NT (amino acids 1–654) the FlnA binding domain (blue). Fluorescent photomicrographs show that GFP-BIG2 NT (containing the FlnA binding domain) is localized to the cytoplasm, whereas GFP-BIG2 NT1 (which lacks the FlnA binding domain) is restricted primarily to the perinuclear region in HEK293 cells. A similar spatial distribution as seen with GFP-BIG2 NT is also appreciated for GFP-BIG2 NT2. D, The expression of BIG2-NT1, but not BIG2-NT2 or BIG2-NT, is more restricted to the perinuclear Golgi (giantin immunostaining). The distribution and overlap with the Golgi is quantified graphically to the right (n = 15, *p < 0.05, **p < 0.01). Scale bars: A, 20 μm; B, D, 10 μm; C, 50 μm.
Figure 6.
Figure 6.
FlnA phosphorylation directs Big2 membrane redistribution from the Golgi to the cell periphery. A, Fluorescent photomicrograph shows BIG2 localized to the membrane lamellipodial ruffles (arrowheads) after forskolin treatment in FLNA-replete A7 but not FLNA-deficient M2 cells. B, Overexpression of constitutively active PAK1 [PAK1-CA; which stimulates FLNA (ser2152) phosphorylation] induces redistribution of HA-BIG2 to the membrane ruffles in FLNA-replete A7 but not FLNA-deficient M2 cells (boxed area). C, Big2 redistribution toward the membrane ruffles (small arrowheads) is colocalized with phosphoFlnA ser2152 after forskolin-induced phosphorylation in FlnA WT progenitor cells. Higher-magnification photomicrograph is seen in bottom panel. D, Treatment of serum-starved CHP100 neuroblastoma cells with forskolin (10 μm, 10 min), serum (10% FBS, 10 min), or preclustered EphB2-Fc (4 μg/ml, 10 min) results in enhanced levels of phosphorylated FLNA (ser2152) compared with untreated serum-starved cells. E, EphB2 treatment redistributes phosphorylated FLNA (ser2152) toward the membrane ruffles with BIG2 in CHP100 cells. Scale bars: A–C, E, 10 μm.
Figure 7.
Figure 7.
FlnA modulates Big2-dependent Arf1 activation in response to Ephrin signaling. A, Treatment of serum-starved Neuro2A cells with preclustered EphB2-Fc (4 μg/ml, 20 min) enhances levels of GTP-bound HA-Arf1 (top blot) detected by Western blot. B, Knockdown of Big2 in serum-starved Neuro2A cells (by Arfgef2 siRNA) decreases the levels of GTP-bound HA-Arf1 (top blot) detected after treatment with preclustered EphB2-Fc (4 μg/ml, 20 min). C, FlnA acute knockdown in Neuro2A cells (by FlnA siRNA) decreases the levels of active HA-Arf1 detected after treatment with preclustered EphB2-Fc (4 μg/ml, 20 min). D, Increased Big2 expression levels, but decreased active Arf1 levels, are detected in FlnA knock-down stable Neuro2A cells line (n = 3 independent experiments for all the results). E, Statistical analysis shows that loss of FlnA leads to decreased Arf1 activity (diminished Arf1-GTP level) and FlnA phosphorylation increases Arf1 activation (n = 3, *p < 0.5, **p < 0.05).
Figure 8.
Figure 8.
Downregulation of Arf1 activity alters cell membrane stability and impairs migration. A, Fluorescent photomicrograph of the cerebral cortices shows that electroporation of the Arf1 dominant-negative construct Arf1T31N leads to a greater number of cells situated near the ventricular lining and intermediate zones compared with GFP labeled cells, which migrate mostly to the cortical plate (right panels). At times, transfection of the Arf1T31N-GFP construct (fluorescein) led to the disruption of the neuroependymal lining (arrows) as shown through loss of Zo-1 (rhodamine) staining and protrusion of cells (Hoechst, blue) into the lateral ventricles. Electroporation of either GFP alone or GFP-tagged dominant-negative Arf1T31N were microinjected into lateral ventricles at E15.5, and mice were killed at E19 for analyses. The brain sections were stained with Hoechst to define the cortical layers (n = 4 for either sex of embryos, and 6–8 serial sections for each embryo were scored). B, The impairment in migration with loss of Arf1 activity in A is graphically summarized (*p < 0.5, **p < 0.05). C, D, In polarized MDCK cells, overexpression of the dominant-negative mutant HA-Arf1T31N causes mislocalization of β-catenin (C) and E-cadherin (D) away from the cell membrane into the cell cytoplasm. In addition, the cell membranes begin to protrude upward into the vertical axis, consistent with a disruption in the integrity of the epithelium. E, In MEF cells, overexpressing HA-Arf1T31N results in a significant decrease in the number of paxillin focal adhesions. MEF cells were transfected with HA-Arf1T31N or HA alone, incubated for 24 h, and then split and plated onto fibronectin-coated cover glasses. Cultures were fixed 3–24 h after replating, and stained for paxillin, phalloidin, and HA-Arf1T31N, as well as vinculin. No changes were seen with vinculin or control HA vector alone (data not shown). The paxillin focal adhesion number is significantly decreased compared with control by 3 h after replating (n = 15 cells and **p < 0.005). F, By 6 h after replating, MEF cells expressing HA-Arf1T31N show a more dramatic decline in the number of paxillin focal adhesions along the cell periphery (n = 15 cells and ***p < 0.001). G, By 24 h after plating, MEF cells expressing HA-Arf1T31N show a trend toward fewer paxillin-stained focal adhesions, although this was not statistically significant (n = 15 cells; arrowheads refer to HA-Arf1T31N-transfected cells, and arrows refer to control cells). Scale bars: A, 200 μm; D, E, 10 μm.

References

    1. Bonifacino JS, Glick BS. The mechanisms of vesicle budding and fusion. Cell. 2004;116:153–166. doi: 10.1016/S0092-8674(03)01079-1. - DOI - PubMed
    1. Boulay PL, Cotton M, Melançon P, Claing A. ADP-ribosylation factor 1 controls the activation of the phosphatidylinositol 3-kinase pathway to regulate epidermal growth factor-dependent growth and migration of breast cancer cells. J Biol Chem. 2008;283:36425–36434. doi: 10.1074/jbc.M803603200. - DOI - PMC - PubMed
    1. Cappello S, Attardo A, Wu X, Iwasato T, Itohara S, Wilsch-Bräuninger M, Eilken HM, Rieger MA, Schroeder TT, Huttner WB, Brakebusch C, Götz M. The Rho-GTPase cdc42 regulates neural progenitor fate at the apical surface. Nat Neurosci. 2006;9:1099–1107. doi: 10.1038/nn1744. - DOI - PubMed
    1. Carreno S, Engqvist-Goldstein AE, Zhang CX, McDonald KL, Drubin DG. Actin dynamics coupled to clathrin-coated vesicle formation at the trans-Golgi network. J Cell Biol. 2004;165:781–788. doi: 10.1083/jcb.200403120. - DOI - PMC - PubMed
    1. Chen PW, Jian X, Yoon HY, Randazzo PA. ARAP2 signals through Arf6 and Rac1 to control focal adhesion morphology. J Biol Chem. 2013;288:5849–5860. doi: 10.1074/jbc.M112.415778. - DOI - PMC - PubMed

Publication types