. 2013 Oct 2;33(40):15999-6008.
doi: 10.1523/JNEUROSCI.1770-13.2013.

Blood oxygen level-dependent activation of the primary visual cortex predicts size adaptation illusion

Affiliations

Blood oxygen level-dependent activation of the primary visual cortex predicts size adaptation illusion

Arezoo Pooresmaeili et al. J Neurosci. .

Abstract

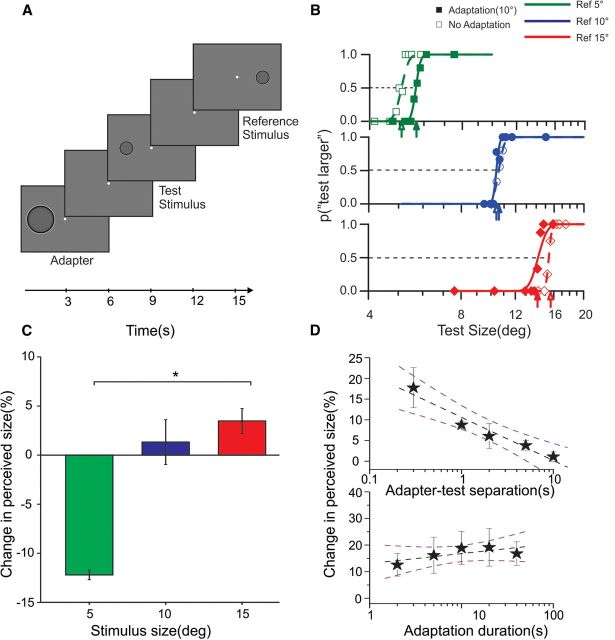
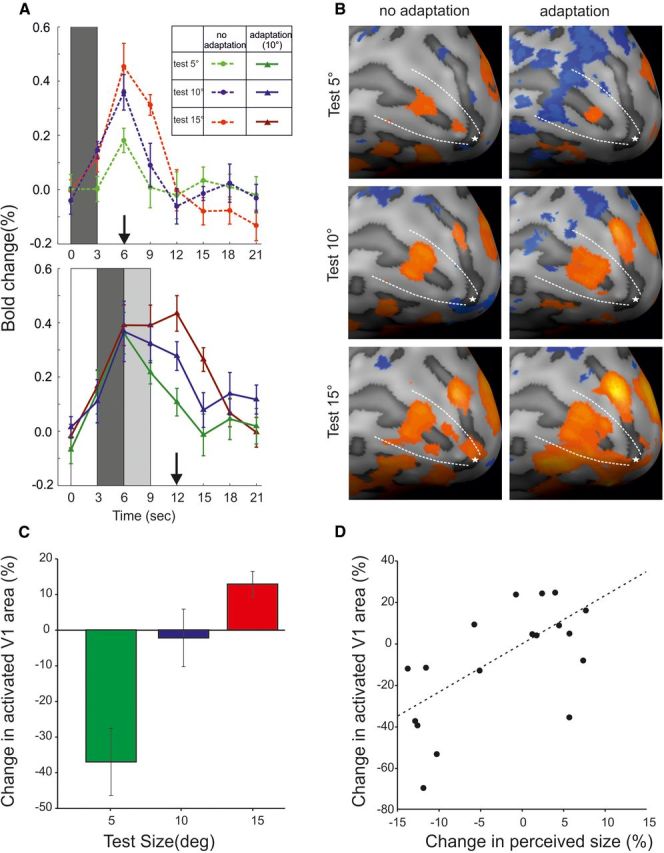
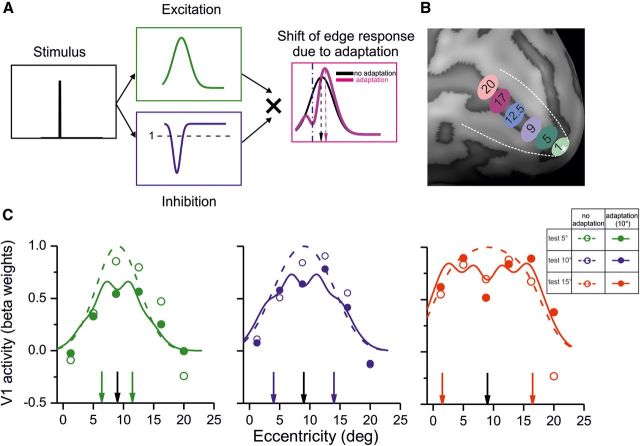
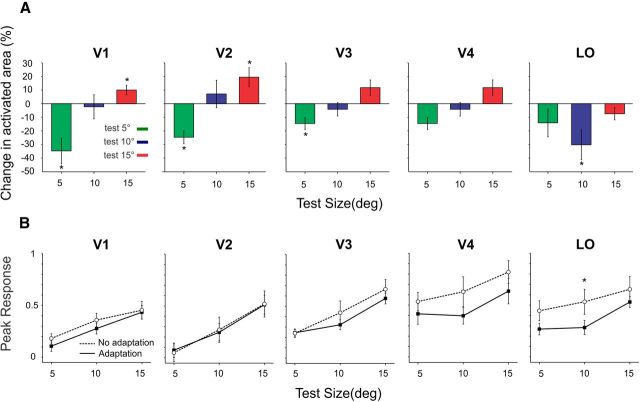
In natural scenes, objects rarely occur in isolation but appear within a spatiotemporal context. Here, we show that the perceived size of a stimulus is significantly affected by the context of the scene: brief previous presentation of larger or smaller adapting stimuli at the same region of space changes the perceived size of a test stimulus, with larger adapting stimuli causing the test to appear smaller than veridical and vice versa. In a human fMRI study, we measured the blood oxygen level-dependent activation (BOLD) responses of the primary visual cortex (V1) to the contours of large-diameter stimuli and found that activation closely matched the perceptual rather than the retinal stimulus size: the activated area of V1 increased or decreased, depending on the size of the preceding stimulus. A model based on local inhibitory V1 mechanisms simulated the inward or outward shifts of the stimulus contours and hence the perceptual effects. Our findings suggest that area V1 is actively involved in reshaping our perception to match the short-term statistics of the visual scene.


Figures

Figure 1.
Figure 1.
Behavioral experiments. A, Subjects discriminated the size of two sequentially presented stimuli (test and reference) displaced horizontally to opposite positions (eccentricity ±9°) relative to screen center. The reference stimulus was 5°, 10°, or 15°, and the size of the test stimulus varied around that of the reference. The stimuli were bandpass images of filled circles, which induced the Craik–O'Brien–Cornsweet illusion (apparent spreading of brightness over the region). In adaptation blocks, the adapter stimulus (10°) was presented before the test centered at the same spatial location. Adapter, test, and the reference stimuli (all at 100% contrast) and the blanks between them were presented for 3 s. B, Psychometric discrimination functions for 5°, 10°, and 15° of a typical subject: when the size of the reference stimulus was 5° (top, green), adaptation to a 10° stimulus resulted in a rightward shift of the psychometric curve, indicating that adaptation decreases the perceived size. When the reference was 10° (middle, blue), no shift in psychometric curve was observed. With larger stimuli (15°, bottom), adaptation led to a leftward shift, indicating an increase in the perceived size. C, Percentage change in perceived size across all subjects: negative values indicate that stimuli appear smaller after adaptation, and positive values indicate that they appear larger. Stimuli of 5° and 15° exhibited a significant change in perceived size with adaptation (*p < 0.05, paired t test). D, Decay of the adaptation effect over time (test size, 5°; adapter size, 10°). Adaptation strength decreases monotonically with increased temporal separation between adapter and test (top; regression slope = −10.44 ± 1.4% per log-second). Changes in adaptation duration, over a range of 2–40 s, do not significantly affect size illusion (bottom, slope of regression = 3.73 ± 2.1% per log-second). The stars depict the average percentage of size change across subjects, the dashed black line is the best linear fit to the data, and the dashed purple lines are the 95% confidence interval of the fit. Error bars are standard error of the mean (SEM).
Figure 2.
Figure 2.
Representation of size illusion in V1 cortex. A, Time course of the event-related V1 activity computed from deconvolved BOLD responses and averaged across all voxels. It should be noted that time courses are from all V1 vertices, defined on anatomical criteria; therefore, higher responses imply a larger spatial extent of activation. The shaded bars indicate the duration of the different events: dark gray, test stimulus; light gray, blank; white, adapter. The responses are aligned to the first event of each trial, i.e., the onset of the test stimulus in no-adaptation blocks and the onset of the adapter in adaptation blocks. The vertical arrows on the abscissa mark the time of maximum responses. B, BOLD activity map of V1 cortex in the adapted and non-adapted condition: the activated cortex shrinks or enlarges when the test is smaller or larger than the adapter, respectively. C, Change in the size of activated V1 cortex (number of vertices suprathreshold) across all subjects, reflecting the decrease, no change, and increase in the size of the activated V1 cortex, when test stimulus was smaller, equal, or larger than the adapter, respectively. D, Correlation between the behavioral and the fMRI effects on each individual subject. Error bars are standard error of the mean (SEM).
Figure 3.
Figure 3.
Adaptation effect and its simulation by gain normalization as a function of eccentricity. A, A computational model of the size adaptation effect: after the presentation of the adapter stimulus, cortical areas representing the edges of the adapter undergo suppression, which can be simulated by a response gain modulation as function of cortical space (blue curve). During presentation of the subsequent test stimulus, activation that would normally be elicited by the stimulus (green curve) will be modulated by the gain modulation set by the previous adapter. The multiplication of the two curves will result in a shift in the representation of the stimulus edges away from the adapter. Such a model would predict that, for large stimuli, the edges are shifted outward, whereas for small stimuli, they will shift inward. B, To test the model depicted in A, responses of six different ROIs at different eccentricities were sampled (1.25° to 20°) C, The responses to the stimuli with and without adaptation are shown at each eccentricity with open and filled circles. The vertical black arrow represents stimulus center (9° eccentricity) and colored arrows the location of stimulus edges at each size. The continuous and dashed curve report the predicted activations based on the model shown in A (for computational details, see Materials and Methods). The curves closely match the measured responses (mean R2 = 81%).
Figure 4.
Figure 4.
Comparison of adaptation effect in different cortical areas. A, Change in the size of activated cortex across all subjects for areas V1, V2, V3, V4, and LO. B, Peak responses measured at the time points marked on the abscissa of Figure 2A to the stimuli of different size, with and without adaptation. Test for statistical significance at p < 0.05, paired t test. Error bars are standard error of the mean (SEM).

Comment in

References

    1. Aglioti S, DeSouza JF, Goodale MA. Size-contrast illusions deceive the eye but not the hand. Curr Biol. 1995;5:679–685. doi: 10.1016/S0960-9822(95)00133-3. - DOI - PubMed
    1. Andersson F, Joliot M, Perchey G, Petit L. Eye position-dependent activity in the primary visual area as revealed by fMRI. Hum Brain Mapp. 2007;28:673–680. doi: 10.1002/hbm.20296. - DOI - PMC - PubMed
    1. Arnold DH, Birt A, Wallis TS. Perceived size and spatial coding. J Neurosci. 2008;28:5954–5958. doi: 10.1523/JNEUROSCI.0578-08.2008. - DOI - PMC - PubMed
    1. Barlow HB. A theory about the functional role and synaptic mechanims of visual after-effects. In: Blakemore C, editor. Vision: coding and efficiency. Cambridge, UK: Cambridge UP; 1990. pp. 363–375.
    1. Blakemore C, Sutton P. Size adaptation: a new aftereffect. Science. 1969;166:245–247. doi: 10.1126/science.166.3902.245. - DOI - PubMed

Publication types

LinkOut - more resources