. 2013 Nov 15;288(46):33096-106.
doi: 10.1074/jbc.M113.511469. Epub 2013 Oct 2.

Low selection pressure aids the evolution of cooperative ribozyme mutations in cells

Affiliations

Low selection pressure aids the evolution of cooperative ribozyme mutations in cells

Zhaleh N Amini et al. J Biol Chem. .

Abstract

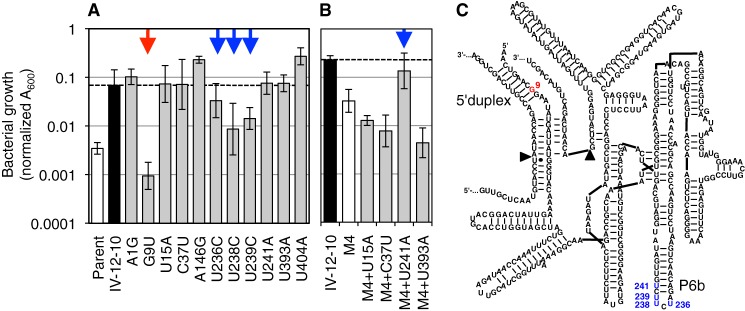
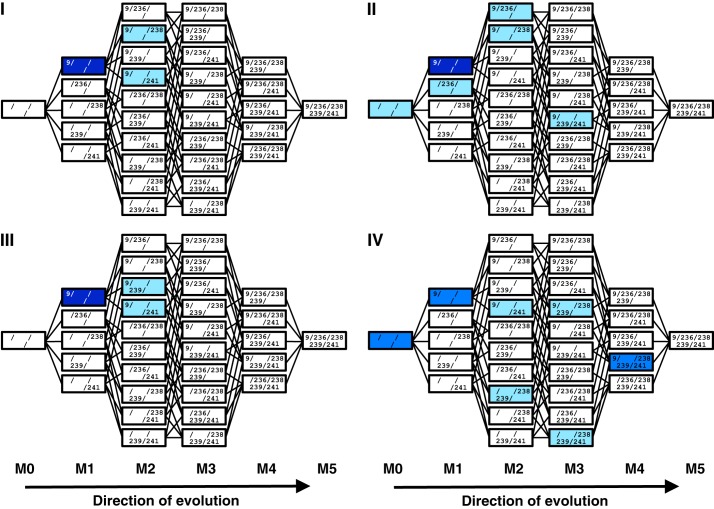
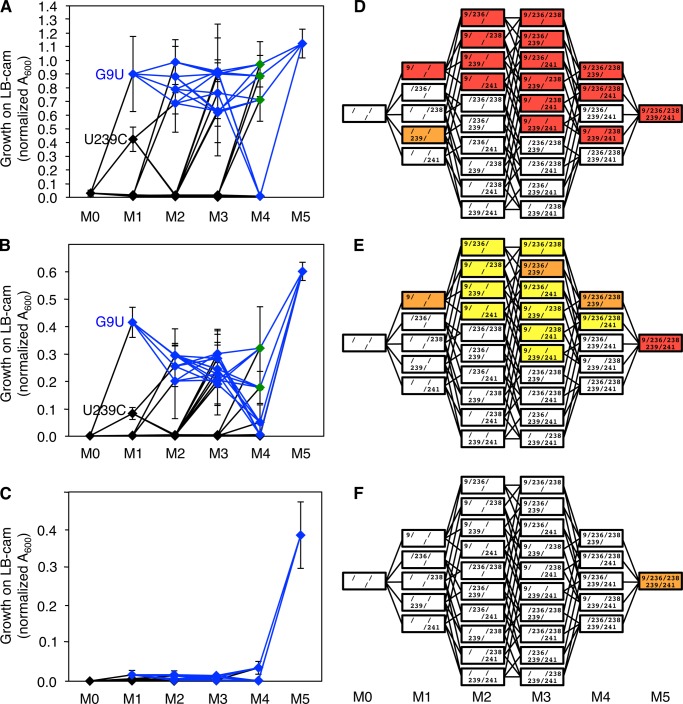
Understanding the evolution of functional RNA molecules is important for our molecular understanding of biology. Here we tested experimentally how two evolutionary parameters, selection pressure and recombination, influenced the evolution of an evolving RNA population. This was done using four parallel evolution experiments that employed low or gradually increasing selection pressure, and recombination events either at the end or dispersed throughout the evolution. As model system, a trans-splicing group I intron ribozyme was evolved in Escherichia coli cells over 12 rounds of selection and amplification, including mutagenesis and recombination. The low selection pressure resulted in higher efficiency of the evolved ribozyme populations, whereas differences in recombination did not have a strong effect. Five mutations were responsible for the highest efficiency. The first mutation swept quickly through all four evolving populations, whereas the remaining four mutations accumulated later and more efficiently under low selection pressure. To determine why low selection pressure aided this evolution, all evolutionary intermediates between the wild type and the 5-mutation variant were constructed, and their activities at three different selection pressures were determined. The resulting fitness profiles showed a high cooperativity among the four late mutations, which can explain why high selection pressure led to inefficient evolution. These results show experimentally how low selection pressure can benefit the evolution of cooperative mutations in functional RNAs.

Keywords: Cooperativity; Escherichia coli; Evolution; RNA Catalysis; Ribozyme.


Figures

FIGURE 1.
FIGURE 1.
Trans-splicing ribozyme variant of the Tetrahymena group I intron that was used as parent construct for the evolutions. A, secondary structure of the ribozyme (black) with its 5′-terminal EGS (green) base-paired to the target site on the substrate (red). The ribozyme 3′-exon is in blue. The 5′-splice site is marked by a filled triangle, the 3′-splice site by an open triangle. The 5′-duplex, P1 helix, the P1 extension helix, and the P10 helix are labeled. The EGS used in this secondary structure is sequence 8 from subfigure (B). B, sequences of 12 designed EGSs that were tested on the ribozyme 5′ terminus. For each sequence, the predicted number of base pairs in the P1 helix and the P10 helix are given on the right. The underlined portion corresponds to the predicted 5′-duplex and the P1 extension helix, the bold portion to the P10 helix. The asterisk denotes a sequence where 3 bp could be formed in the P1 extension helix but are not predicted to form due to a self-structure of the EGS. C, ability of the 12 different EGSs to increase E. coli growth rates in the presence of chloramphenicol due to the repair of CAT pre-mRNA in the cells. The doubling time of E. coli cells is given for all 12 constructs, in LB medium containing 2 μg/ml chloramphenicol (open squares) and 6 μg/ml chloramphenicol (filled squares). Note that the symbols are slightly offset to clarify the error bars. EGS variant 10 did not mediate measurable growth. Note that low doubling times correspond to high ribozyme efficiencies. EGS variant 8 was chosen for the parent ribozyme of the evolution.
FIGURE 2.
FIGURE 2.
Evolution of the trans-splicing ribozyme under four different conditions (I–IV), which differed in selection pressure and recombination. A, schematic for the 12 rounds of evolution for the four separate lines. Nine rounds with mutagenesis (M, blue) and three rounds with recombination (R, red) were followed by two rounds without mutagenesis or recombination (E, black). B, selection pressure over the course of the evolution, given as the concentration of chloramphenicol in selection medium. The selection pressure for the lines I (white) and III (dark gray) increased with the activity of the pool, whereas the selection pressure for the lines II (light gray) and IV (black) was kept low, never exceeding 10 μg/ml chloramphenicol concentration. The selection pressures in rounds 13 and 14 were at the same high levels for all four lines, to select the most active ribozymes from each population. C, average number of mutations per ribozyme plotted as a function of the evolution rounds, for line I (white), II (light gray), III (dark gray), and IV (black). Each value is the average from 5–10 sequences, with error bars denoting the S.E. Note that the symbols are slightly offset to clarify the error bars. D, activities of ribozyme pools after evolution round 14, measured as cell growth on plates containing 350 μg/ml chloramphenicol. The cell growth was normalized for growth on medium with ampicillin. Error bars are S.D. of three experiments.
FIGURE 3.
FIGURE 3.
Secondary structure representations of the mutations identified after 14 rounds of evolution in each of the four lines. Note that these mutations reflect the most active ribozymes after two rounds of enrichment at high selection pressure (rounds 13 and 14). The line (I–IV) is given for each secondary structure. For each structure, 10 sequences were analyzed. The color of the nucleotide corresponds to the frequency with which the nucleotide was found mutated: red, 8–10 mutations; green, 5–7 mutations; blue, 2–4 mutations; black, 0–1 mutation. See Fig. 1 for explanations on the secondary structure. The positions of the P6b stem-loop, P9.2 stem-loop, and the 5′-duplex are indicated. Note that the mutations in the P6b loop are highly enriched in lines II and IV but not in lines I and III.
FIGURE 4.
FIGURE 4.
PCR analysis of mutations generated. A, distribution of 128 mutations generated by mutagenic PCR (blue) over the 414 nucleotide positions of the Tetrahymena ribozyme. The green rectangle shows the position of the P6b stem-loop mutations (positions 236–241). B, frequency of multiple mutation occurrences at the same position. Of the 414 positions, the number of positions is shown with 0, 1, 2, 3, and 4 mutations (blue). Five data sets with a random distribution are shown as comparison (black). C, mutational bias in the type of mutations. For each of the six types of mutations, their number of occurrences (total = 128) and their relative frequencies are shown. One insertion and 12 deletions were also detected (data not included).
FIGURE 5.
FIGURE 5.
Identification of mutations that increased ribozyme activity, among the 11 mutations in clone IV-12-10. A, activity of clone IV-12-10 variants that carried single reversion mutations toward the parent ribozyme. Activity was measured as growth on LB agar containing 200 μg/ml chloramphenicol. Note the logarithmic scale that shows the growth as measured as A600. Growth of the parent ribozyme is shown as comparison, and a horizontal dashed line is shown for comparison with clone IV-12-10. The red arrow indicates a mutation reversion with >10-fold effect (G9U); the blue arrows indicate mutation reversions with <10-fold effect. B, five mutations were necessary to mediate full activity. A ribozyme containing only the four mutations identified in subfigure A (ribozyme variant M4) did not mediate full activity compared with the IV-12-10 variant. Three additional candidate mutations were added to ribozyme M4 and measured for growth in the presence of 200 μg/ml chloramphenicol. Mutation U241A, in combination with the four mutations identified in subfigure A, was found to be necessary and sufficient for full activity observed in the IV-12-10 variant. Secondary structure of the ribozyme with the positions of beneficial mutations indicated. Colorcoding is as in A. The helices containing these mutations are labeled as 5′-duplex and P6b.
FIGURE 6.
FIGURE 6.
Accumulation of evolutionary intermediates of the M5 ribozyme in rounds 10–12 of the evolution. For each of the four lines of evolution (I, II, III, and IV), all 32 evolutionary intermediates are shown, with each intermediate represented as one box. The individual mutations are listed inside. Parent ribozymes (M0) are shown on the left, and the 5-mutant ribozymes (M5) on the right. Colors illustrate the frequency with which the specific evolutionary intermediates were identified among 20 clones for each line of evolution. Light blue, 1–2 clones; blue, 3–10 clones; dark blue, 11–20 clones.
FIGURE 7.
FIGURE 7.
Fitness profile of all evolutionary intermediates from the parent ribozyme (M0) to the M5 ribozyme (M5), at three selection pressures. A–C, intermediates are labeled according the their number of M5 mutations (M1, M2, M3, and M4). The selection pressures correspond to chloramphenicol concentrations of 10 μg/ml (A), 100 μg/ml (B), and 200 μg/ml (C). The fitness was measured as growth on medium containing the respective chloramphenicol concentration. The two M1 ribozymes that display significant growth are labeled (G9U and U239C). All evolutionary intermediates with the G9U mutation are shown in blue or green and connected by blue lines. Green symbols highlight the gatekeeper intermediates (see the “Results” section concerning Fig. 7, and see the third paragraph of the “Discussion”). The values for all intermediates at all selection pressures are given in supplemental Fig. S2. Error bars are S.D. from three biological experiments. D–F, corresponding heat maps: 10 μg/ml (D), 100 μg/ml (E), and 200 μg/ml (F). The arrangement of evolutionary intermediates is the same as in Fig. 6. Colors denote fitness values >0.6 (red), 0.6–0.3 (orange), 0.3–0.1 (yellow), and <0.1 (white).

References

    1. Noller H. F., Hoffarth V., Zimniak L. (1992) Unusual resistance of peptidyl transferase to protein extraction procedures. Science 256, 1416–1419 - PubMed
    1. Nissen P., Hansen J., Ban N., Moore P. B., Steitz T. A. (2000) The structural basis of ribosome activity in peptide bond synthesis. Science 289, 920–930 - PubMed
    1. Guerrier-Takada C., Gardiner K., Marsh T., Pace N., Altman S. (1983) The RNA moiety of ribonuclease P is the catalytic subunit of the enzyme. Cell 35, 849–857 - PubMed
    1. Padgett R. A., Grabowski P. J., Konarska M. M., Seiler S., Sharp P. A. (1986) Splicing of messenger RNA precursors. Annu. Rev. Biochem. 55, 1119–1150 - PubMed
    1. Valadkhan S. (2005) snRNAs as the catalysts of pre-mRNA splicing. Curr. Opin. Chem. Biol. 9, 603–608 - PubMed

Publication types

MeSH terms