

Proteome variations in pancreatic stellate cells upon stimulation with proinflammatory factors
- PMID: 24089530
- PMCID: PMC3820885
- DOI: 10.1074/jbc.M113.488387
Proteome variations in pancreatic stellate cells upon stimulation with proinflammatory factors
Abstract
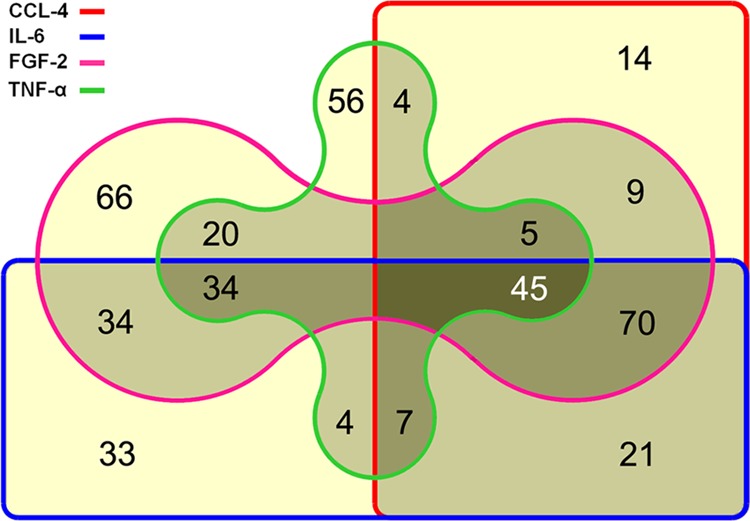
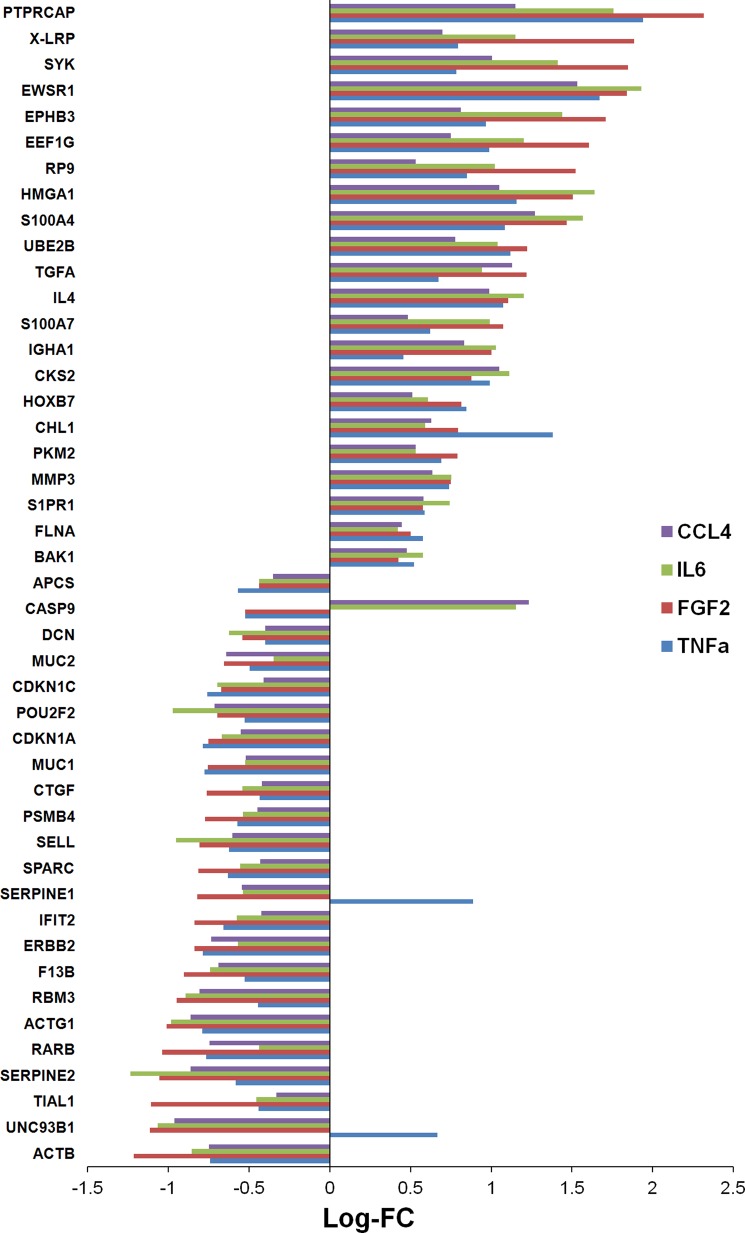
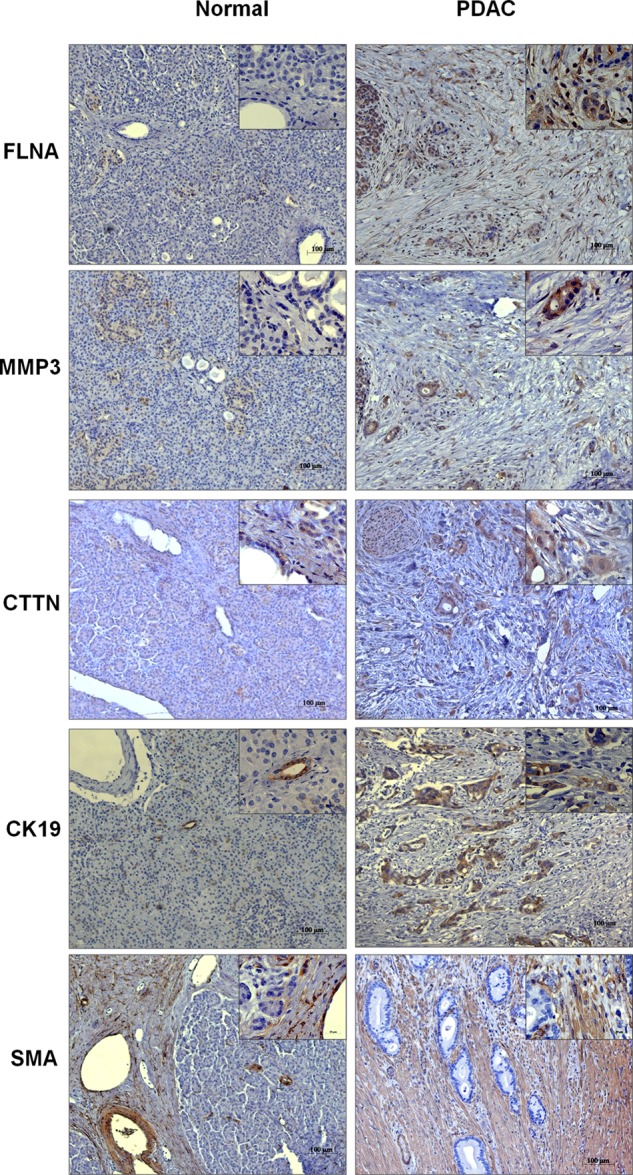
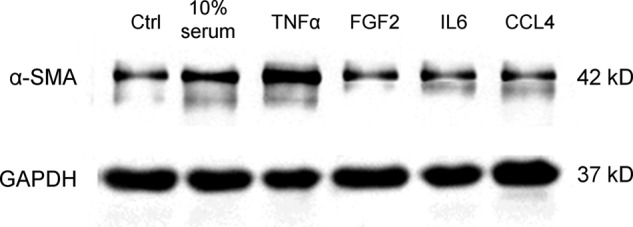
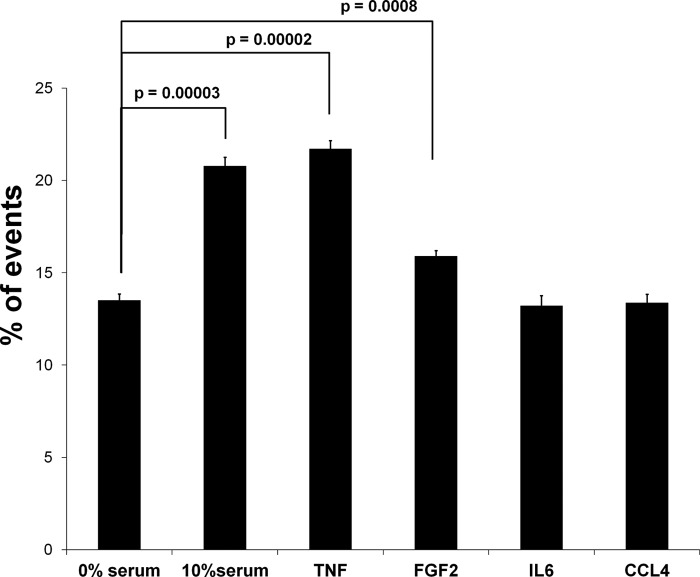
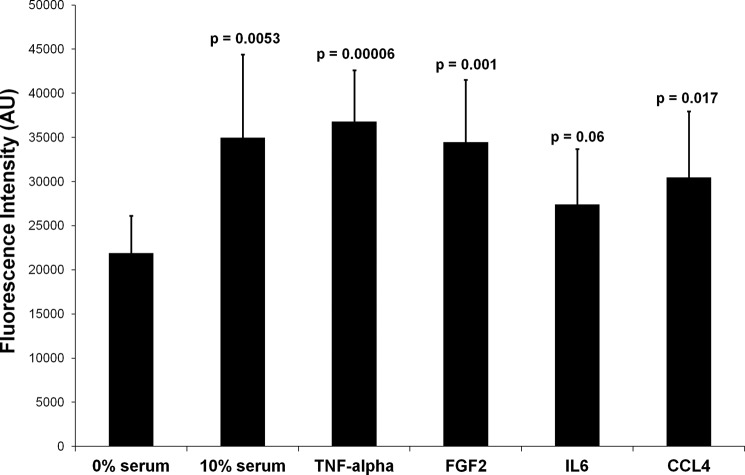
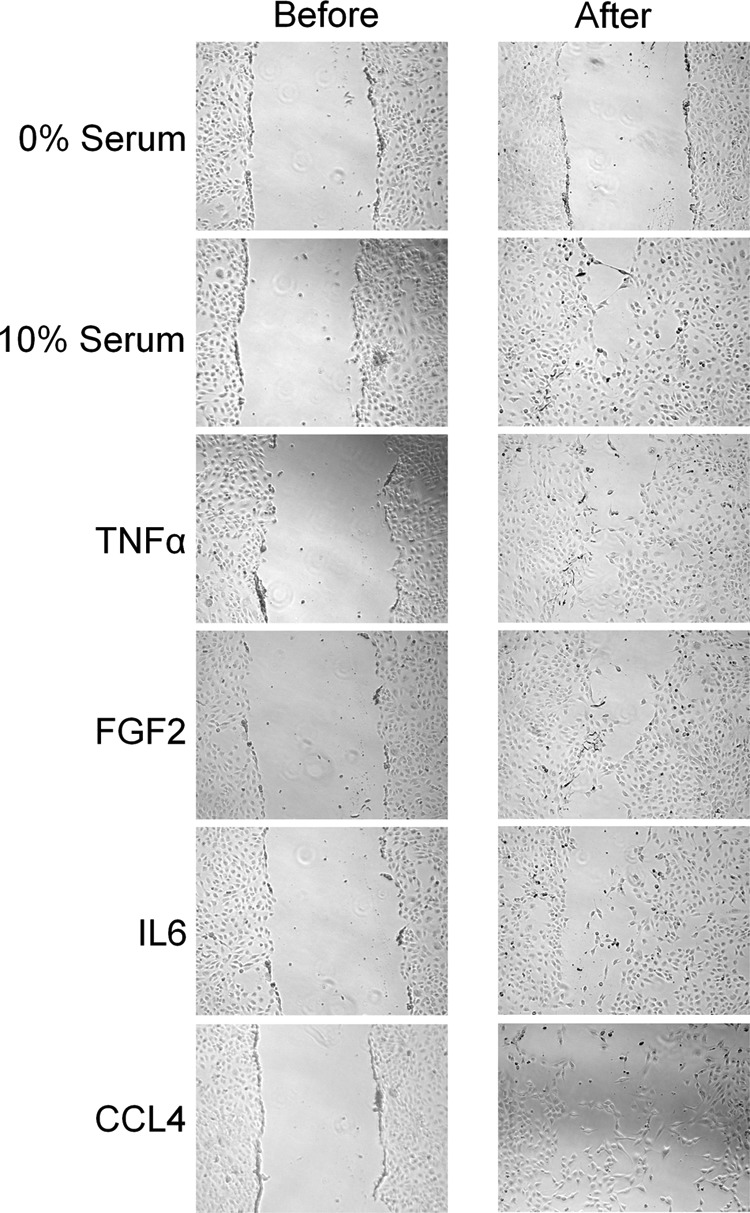
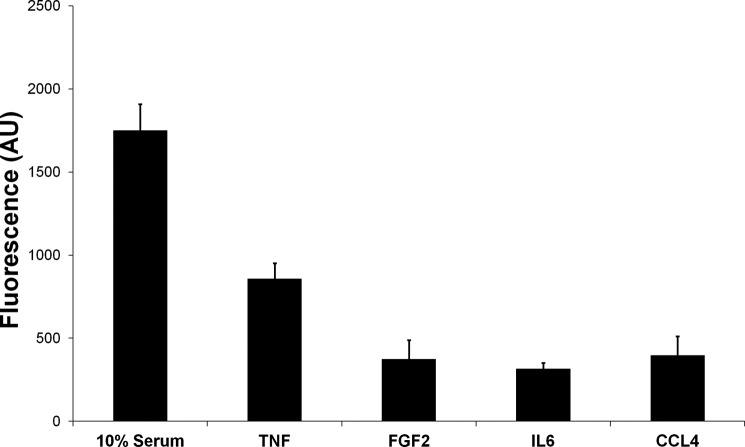
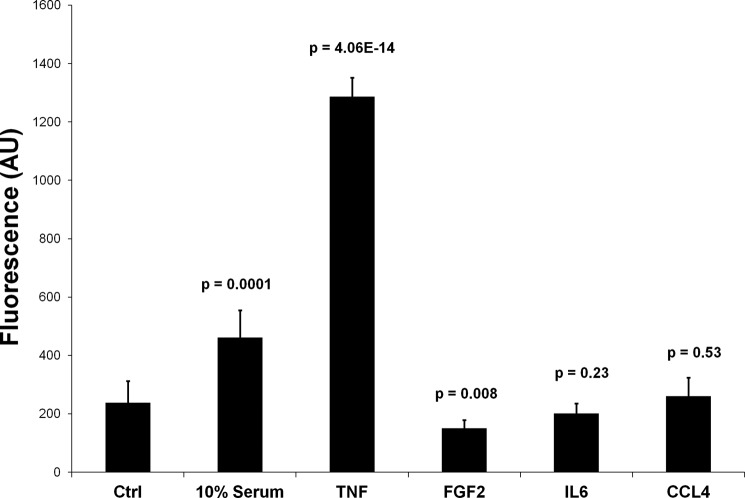
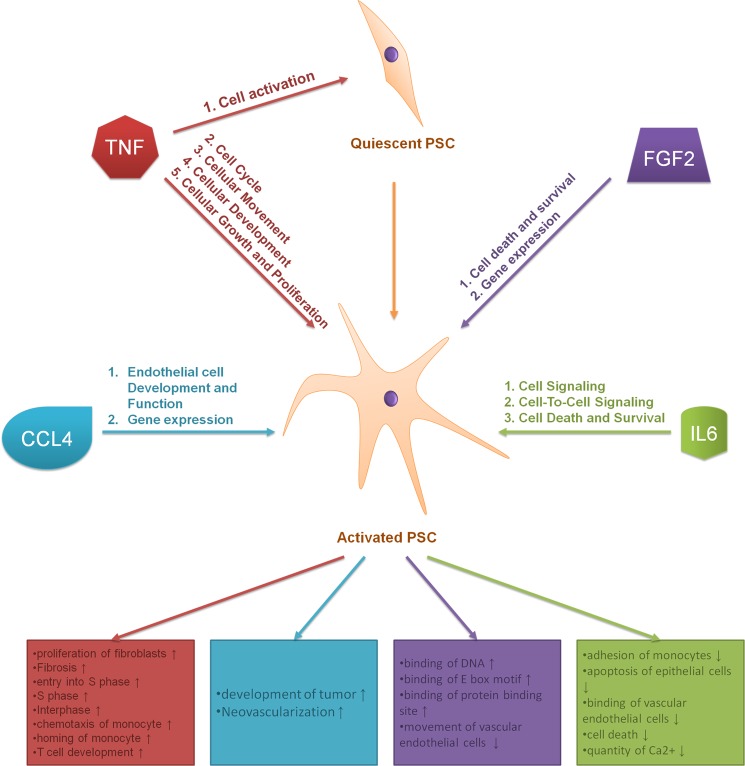
Pancreatic stellate cells are key mediators in chronic pancreatitis and play a central role in the development of pancreatic fibrosis, stromal formation, and progression of pancreatic cancer. This study was aimed at investigating molecular changes at the level of the proteome that are associated with the activation of pancreatic stellate cells by proinflammatory factors, namely TNF-α, FGF2, IL6, and chemokine (C-C motif) ligand 4 (CCL4). They were added individually to cells growing in serum-free medium next to controls in medium supplemented with serum, thus containing a mixture of them all, or in serum-free medium alone. Variations were detected by means of a microarray of 810 antibodies targeting relevant proteins. All tested factors triggered increased proliferation and migration. Further analysis showed that TNF-α is the prime factor responsible for the activation of pancreatic stellate cells. CCL4 is associated with cellular neovascularization, whereas FGF2 and IL6 induction led to better cellular survival and decreased apoptotic activity of the stellate cells. The identified direct effects of individual cytokines on human pancreatic stellate cells provide new insights about their contribution to pancreatic cancer promotion.
Keywords: Antibody Microarray; Microarray; Pancreatic Cancer; Pancreatic Stellate Cell; Proteomics; Stromal Cell; Tumor Necrosis Factor (TNF).
Figures
References
-
- Jemal A., Siegel R., Ward E., Hao Y., Xu J., Thun M. J. (2009) Cancer statistics, 2009. CA-Cancer J. Clin. 59, 225–249 - PubMed
-
- Li D., Xie K., Wolff R., Abbruzzese J. L. (2004) Pancreatic cancer. Lancet 363, 1049–1057 - PubMed
-
- Matsubara J., Ono M., Honda K., Negishi A., Ueno H., Okusaka T., Furuse J., Furuta K., Sugiyama E., Saito Y., Kaniwa N., Sawada J., Shoji A., Sakuma T., Chiba T., Saijo N., Hirohashi S., Yamada T. (2010) Survival prediction for pancreatic cancer patients receiving gemcitabine treatment. Mol. Cell. Proteomics 9, 695–704 - PMC - PubMed
-
- Yokoyama Y., Nimura Y., Nagino M. (2009) Advances in the treatment of pancreatic cancer. Limitations of surgery and evaluation of new therapeutic strategies. Surg. Today 39, 466–475 - PubMed
-
- Fidler I. J. (2002) The organ microenvironment and cancer metastasis. Differentiation 70, 498–505 - PubMed
Publication types
MeSH terms
Substances
LinkOut - more resources
Full Text Sources
Other Literature Sources
Research Materials
