. 2013 Nov 15;288(46):33006-15.
doi: 10.1074/jbc.M113.460741. Epub 2013 Oct 2.

Expression and regulatory effects of murine Schlafen (Slfn) genes in malignant melanoma and renal cell carcinoma

Affiliations

Expression and regulatory effects of murine Schlafen (Slfn) genes in malignant melanoma and renal cell carcinoma

Evangelos Mavrommatis et al. J Biol Chem. .

Abstract

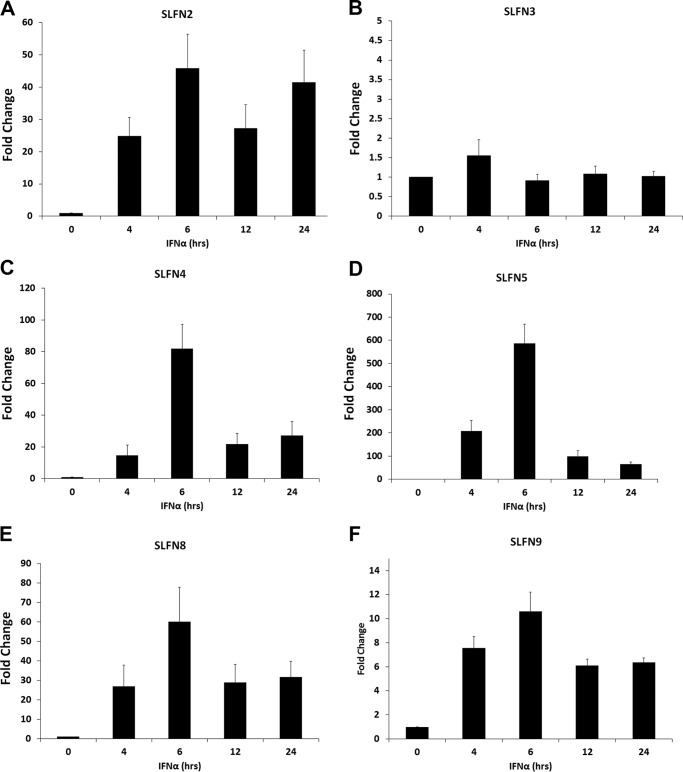
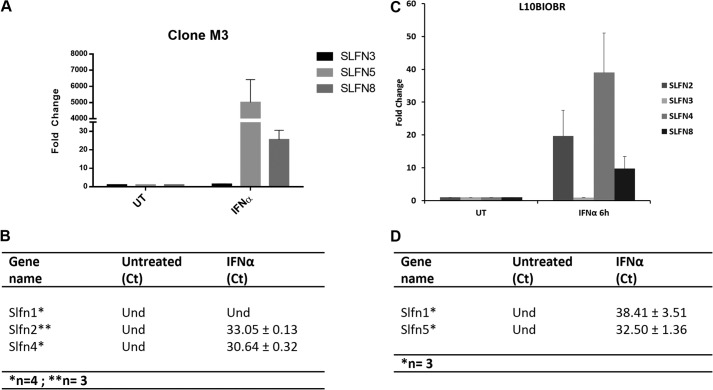
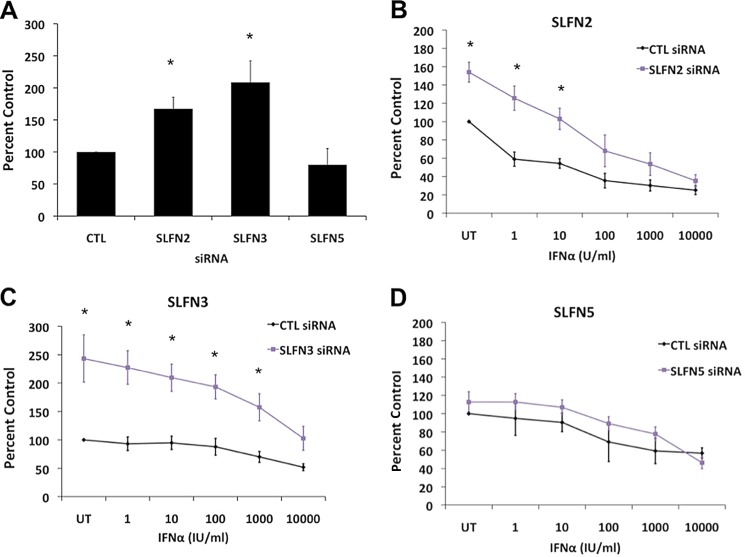
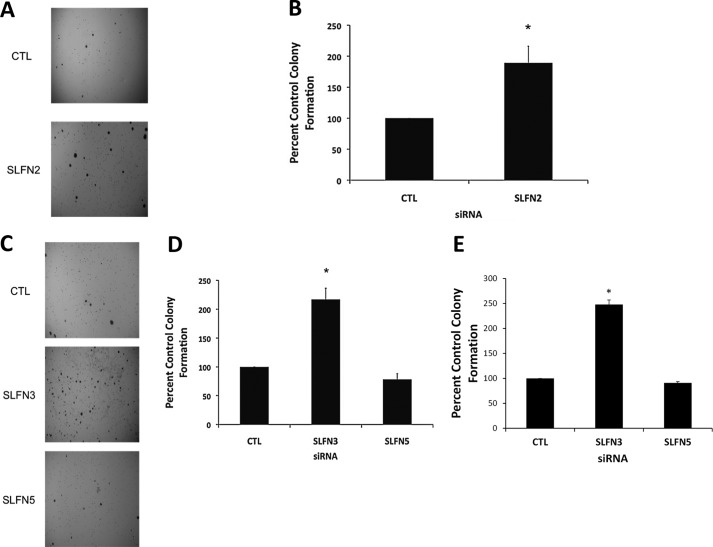
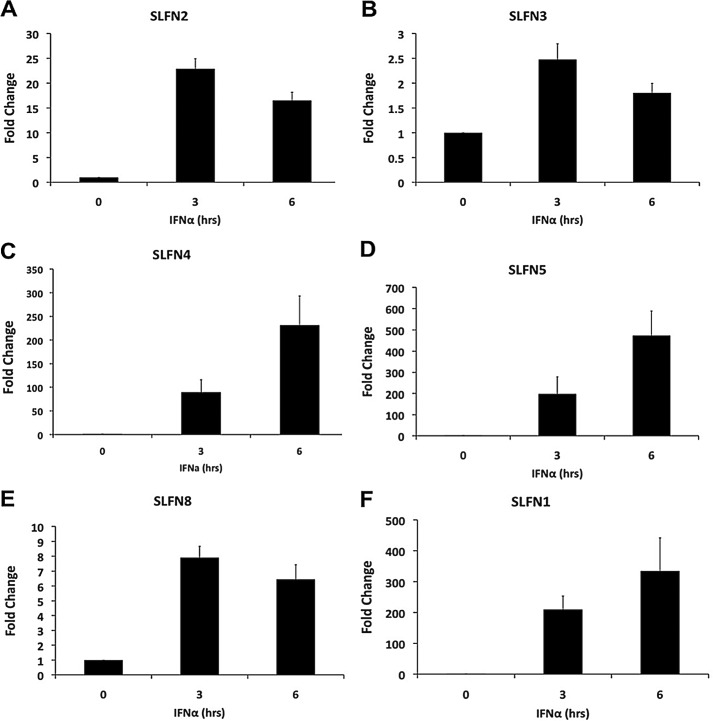
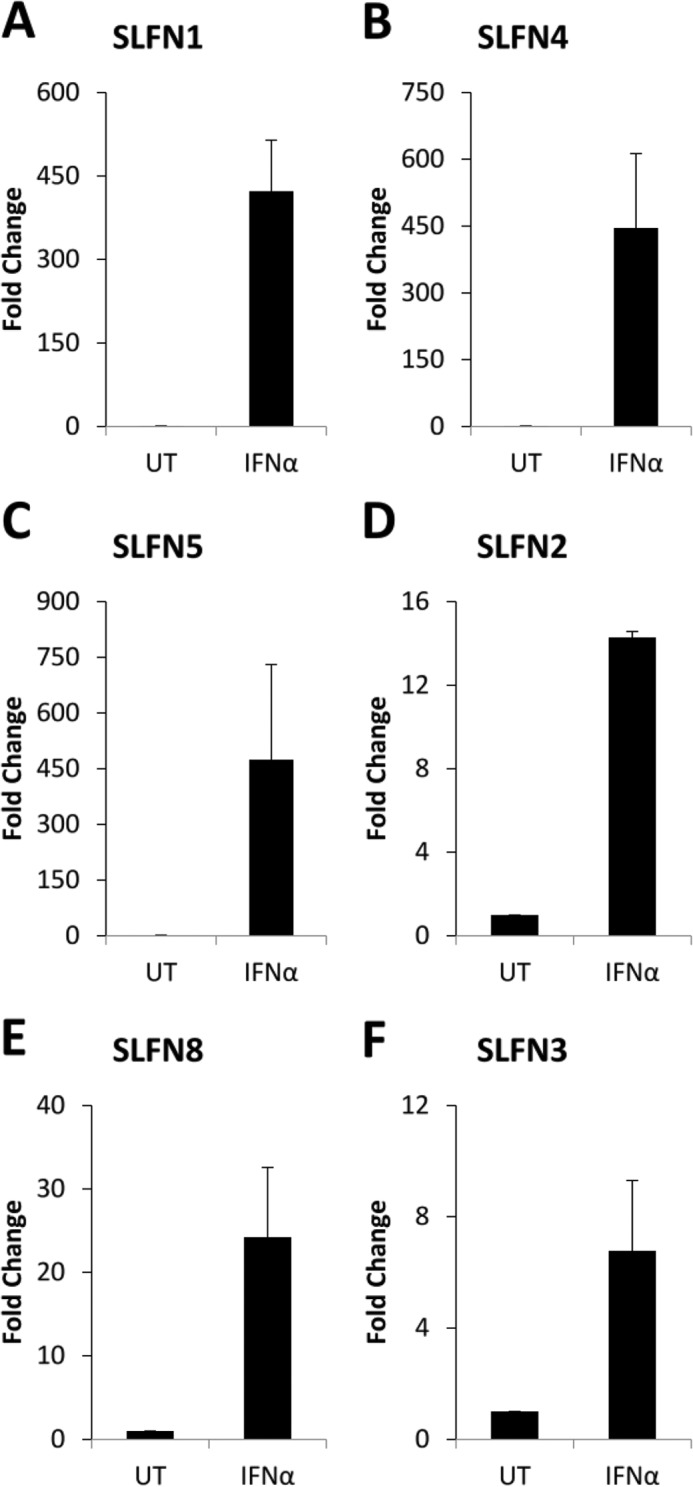
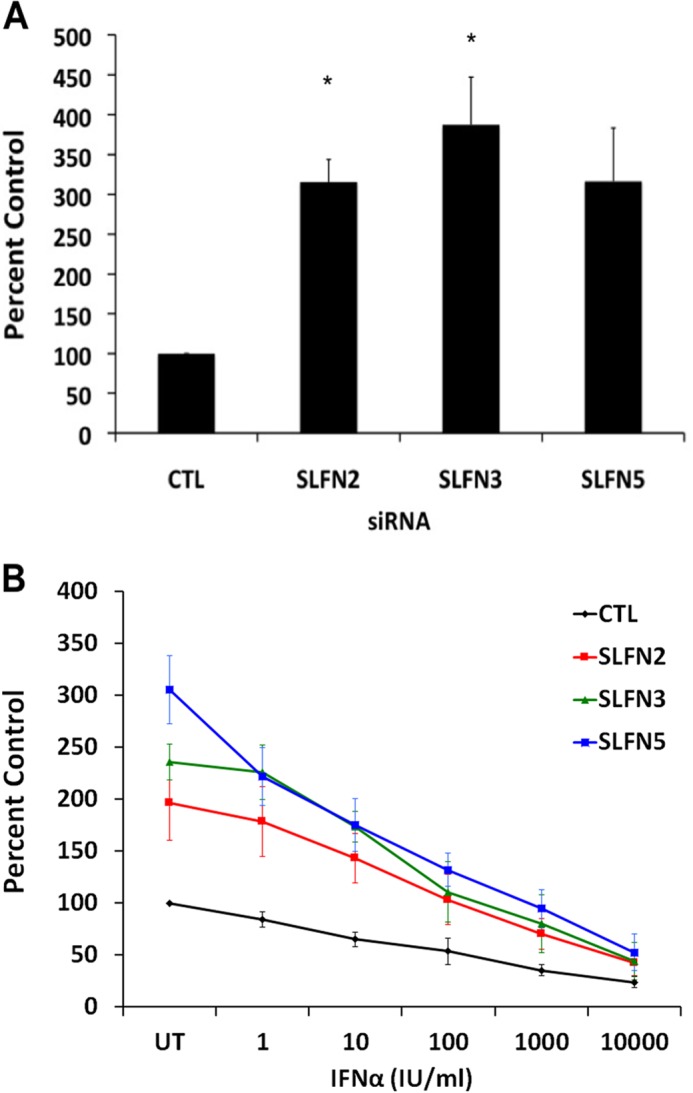
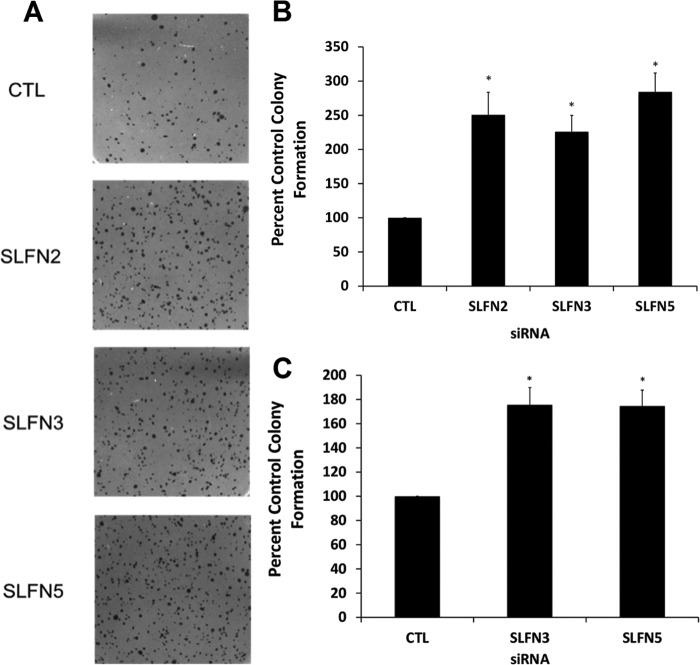
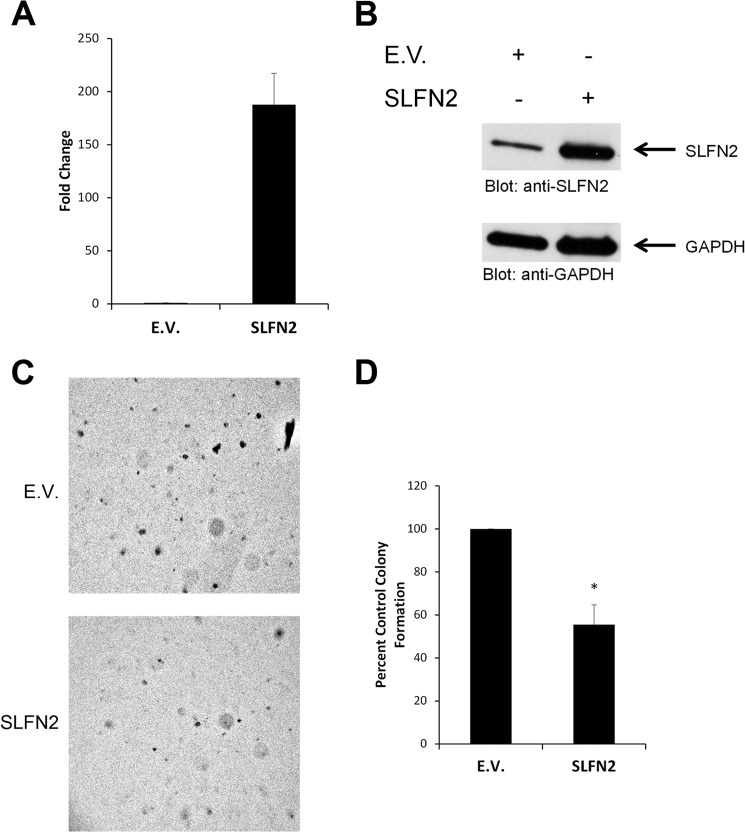
There is emerging evidence that the IFN-inducible family of Slfn genes and proteins play important roles in cell cycle progression and control of cellular proliferation, but the precise functional roles of different Slfn members in the regulation of tumorigenesis remain unclear. In the present study, we undertook a systematic analysis on the expression and functional relevance of different mouse Slfn genes in malignant melanoma and renal cell carcinoma cells. Our studies demonstrate that several mouse Slfn genes are up-regulated in response to IFN treatment of mouse melanoma and renal cell carcinoma cells, including Slfn1, Slfn2, Slfn4, Slfn5, and Slfn8. Our data show that Slfn2 and Slfn3 play essential roles in the control of mouse malignant melanoma cell proliferation and/or anchorage-independent growth, suggesting key and non-overlapping roles for these genes in the control of malignant melanoma tumorigenesis. In renal cell carcinoma cells, in addition to Slfn2 and Slfn3, Slfn5 also exhibits important antineoplastic effects. Altogether, our findings indicate important functions for distinct mouse Slfn genes in the control of tumorigenesis and provide evidence for differential involvement of distinct members of this gene family in controlling tumorigenesis. They also raise the potential of future therapeutic approaches involving modulation of expression of members of this family of genes in malignant melanoma and renal cell carcinoma.

Keywords: Antiviral Agents; Cell Death; Innate Immunity; Interferon; Schlafen; Signal Transduction; Signaling.


Figures

FIGURE 1.
FIGURE 1.
Type I IFN-dependent expression of mouse Slfn genes in malignant melanoma cells. B16-F1 cells were treated with IFNα for the indicated times. Expression of Slfn2 (A), Slfn3 (B), Slfn4 (C), Slfn5 (D), Slfn8 (E), and Slfn1 (F) was measured by quantitative real-time RT-PCR using specific primers and was normalized to GAPDH. Data are expressed as fold increase compared with untreated samples and represent means ± S.E. of the indicated number of experiments: Slfn2 (n = 4), Slfn3 (n = 4), Slfn4 (n = 4), Slfn5 (n = 4), Slfn8 (n = 4), and Slfn1 (n = 2).
FIGURE 2.
FIGURE 2.
Type I IFN-dependent expression of mouse Slfn genes in malignant melanoma and immortalized murine melanocyte cells. Clone M3 and L10BIOBR cells were treated with IFNα for the indicated time. Expression of Slfn3, Slfn5, and Slfn8 (A); Slfn1, Slfn2, and Slfn4 (B) in clone M3; and the expression of Slfn2, Slfn3, Slfn4, and Slfn8 (C); and Slfn1 and Slfn5 (D) in L10BIOBR were measured by quantitative real time RT-PCR using specific primers and were normalized to GAPDH. Data are expressed as fold increase compared with untreated (UT) samples and represent means ± S.E. of the indicated number of experiments: Slfn3, Slfn5, Slfn8, Slfn1, and Slfn4 (n = 4) and Slfn2 (n = 3). Und, undetected.
FIGURE 3.
FIGURE 3.
Effect of knockdown of different mouse Slfns on cell proliferation of malignant melanoma cells. A, B16-F1 cells were transfected with control siRNAs or siRNAs specific for Slfn2, Slfn3, or Slfn5 as indicated. 48 h post-transfection, an equal number of cells was plated and allowed to proliferate for 72 h, at which time point the cells were counted. Data are expressed as % control siRNA samples and represent means ± S.E. of four experiments. *, p < 0.05 versus control siRNA cells. B–D, B16-F1 cells transfected with siRNAs against the indicated Slfn genes were treated with indicated doses of IFNα, and proliferation was measured by MTT assays. Data are expressed as % untreated (UT) control (CTL) siRNA samples and represent means ± S.E. of the several experiments. *, p < 0.05, Slfn2 (n = 5), Slfn3 (n = 5), and Slfn5 (n = 3). Und, undetected.
FIGURE 4.
FIGURE 4.
Effects of knockdown of different Slfn genes on anchorage-independent malignant melanoma cell growth. A, B16-F1 cells were transfected with control siRNA or Slfn2 siRNA. Equal number of cells were plated in soft agar and allowed to form colonies for 14 days. Representative images of the soft agar wells are shown. B, quantitation of colonies from four independent experiments, including the one shown in A. Data are expressed as % control siRNA transfected cells and represent means ± S.E. of four experiments. *, p < 0.05. C, B16-F1 cells were transfected with control siRNA or Slfn3 or Slfn5 siRNAs. An equal number of cells was plated in soft agar and allowed to form colonies for 14 days. Representative images of the soft agar wells are shown. D, quantitation of colonies from four independent experiments, including the one shown in C. Data are expressed as % control siRNA transfected cells and represent means ± S.E. of four experiments. *, p < 0.05. E, clone M3 cells were transfected with control (CTL) siRNA or Slfn3 or Slfn5 siRNAs. An equal number of cells was plated in soft agar, and colonies from four independent experiments were quantified after 14 days. Data are expressed as % control siRNA-transfected cells and represent means ± S.E. of four experiments. *, p < 0.05.
FIGURE 5.
FIGURE 5.
Type I IFN-dependent expression of mouse Slfn genes in renal cell carcinoma. A–E, RENCA cells were treated with IFNα for the indicated times. mRNA expression for Slfn2 (A), Slfn3 (B), Slfn4 (C), Slfn5 (D), Slfn8 (E), and Slfn1 (F) was measured by quantitative real-time RT-PCR using specific primers and was normalized to GAPDH. Data are expressed as fold increase over untreated samples. Data represent means ± S.E. of several experiments for each Slfn gene as follows: Slfn2 (n = 4), Slfn3 (n = 4), Slfn4 (n = 4), Slfn5 (n = 3), Slfn8 (n = 4), and Slfn1 (n = 3).
FIGURE 6.
FIGURE 6.
Type I IFN-dependent expression of mouse Slfn genes in kidney carcinoma cells. CD3575 cells were treated with mouse IFNα for the indicated time. Expression of Slfn1 (A), Slfn4 (B), Slfn5 (C), Slfn2 (D), Slfn8 (E), and Slfn3 (F) in CD3575 was measured by quantitative real-time PCR using specific primers and was normalized to GAPDH. Data are expressed as fold increase compared with untreated (UT) samples and represent means ± S.E. of three independent experiments.
FIGURE 7.
FIGURE 7.
Effects of knockdown of different mouse Slfns on cell proliferation of mouse renal cell carcinoma cells. A, RENCA cells were transfected with control siRNAs or siRNAs specific for Slfn2, Slfn3, or Slfn5 as indicated. 48 h post-transfection, an equal number of cells was plated and allowed to proliferate for 72 h, at which time the cells were counted. Data are expressed as % of control (CTL) siRNA-transfected samples and represent means ± S.E. of three experiments. *, p < 0.05 versus control siRNA cells. B, transfected RENCA cells were treated with indicated doses of IFNα, and viability was assessed by MTT assays. Data are expressed as % untreated control (CTL) siRNA samples and represent means ± S.E. of five experiments. *, p < 0.05 control versus Slfn2, control versus Slfn5, **, p < 0.05 control versus Slfn2, control versus Slfn3, control versus Slfn5.
FIGURE 8.
FIGURE 8.
Effects of knockdown of Slfn2, Slfn3, and Slfn5 on anchorage-independent RCC cell growth. A, RENCA cells were transfected with control siRNA or Slfn2, Slfn3, or Slfn5 siRNAs. Equal number of cells were plated in soft agar and allowed to form colonies for 14 days. Representative images of the soft agar wells are shown. B, quantitation of colonies from four independent experiments, including the one shown in A. Data are expressed as % control siRNA-transfected cells and represent means ± S.E. of four experiments. *, p < 0.05. C, CD3575 cells were transfected with control siRNA or Slfn3 or Slfn5 siRNAs. Equal number of cells were plated in soft agar and colonies were quantified after 14 days. Data are expressed as % control (CTL) siRNA-transfected cells and represent means ± S.E. of four experiments.
FIGURE 9.
FIGURE 9.
Effects of overexpression of mouse Slfn2 on cell proliferation and anchorage-independent growth in kidney carcinoma cells. A and B, CD3575 cells were transiently transfected with either empty vector (E.V.) or Slfn2 cDNA. Levels of Slfn2 were quantified at 48 h post-transfection by quantitative RT-PCR (A) or examined by immunoblotting (B). The quantitative RT-PCR data are expressed as fold increase in the Slfn2-transfected samples over empty vector transfected samples normalized to GAPDH and represent means ± S.E. from two independent experiments performed in triplicate. C, CD3575 cells were transiently transfected with either empty vector (E.V.) or Slfn2 cDNA. An equal number of cells was plated in soft agar and allowed to form colonies for 8 days. Representative images of the soft agar wells are shown. D, quantitation of colonies from three independent experiments, including the one shown in A. Data are expressed as % control empty vector transfected cells and represent means ± S.E. of three experiments performed in triplicate. *, p < 0.05.

References

    1. Schwarz D. A., Katayama C. D., Hedrick S. M. (1998) Schlafen, a new family of growth regulatory genes that affect thymocyte development. Immunity 9, 657–668 - PubMed
    1. Bustos O., Naik S., Ayers G., Casola C., Perez-Lamigueiro M. A., Chippindale P. T., Pritham E. J., de la Casa-Esperón E. (2009) Evolution of the Schlafen genes, a gene family associated with embryonic lethality, meiotic drive, immune processes and orthopoxvirus virulence. Gene 447, 1–11 - PMC - PubMed
    1. Geserick P., Kaiser F., Klemm U., Kaufmann S. H., Zerrahn J. (2004) Modulation of T cell development and activation by novel members of the Schlafen (slfn) gene family harbouring an RNA helicase-like motif. Int. Immunol. 16, 1535–1548 - PubMed
    1. Brady G., Boggan L., Bowie A., O'Neill L. A. (2005) Schlafen-1 causes a cell cycle arrest by inhibiting induction of cyclin D1. J. Biol. Chem. 280, 30723–30734 - PubMed
    1. Bell T. A., de la Casa-Esperón E., Doherty H. E., Ideraabdullah F., Kim K., Wang Y., Lange L. A., Wilhemsen K., Lange E. M., Sapienza C., de Villena F. P. (2006) The paternal gene of the DDK syndrome maps to the Schlafen gene cluster on mouse chromosome 11. Genetics 172, 411–423 - PMC - PubMed

Publication types

MeSH terms

LinkOut - more resources