

Identifying cell class specific losses from serially generated electroretinogram components
- PMID: 24089688
- PMCID: PMC3781995
- DOI: 10.1155/2013/796362
Identifying cell class specific losses from serially generated electroretinogram components
Abstract
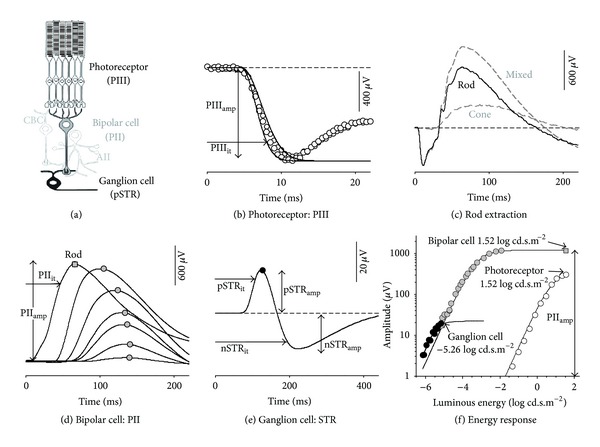
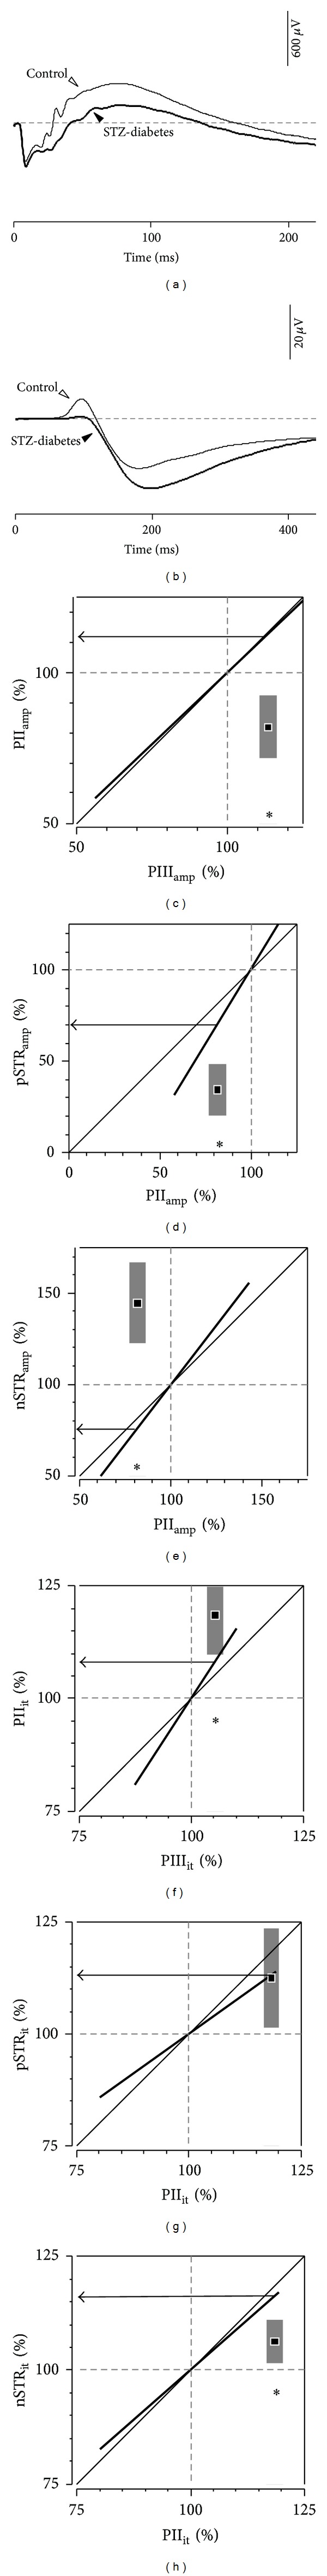
Purpose: Processing of information through the cellular layers of the retina occurs in a serial manner. In the electroretinogram (ERG), this complicates interpretation of inner retinal changes as dysfunction may arise from "upstream" neurons or may indicate a direct loss to that neural generator. We propose an approach that addresses this issue by defining ERG gain relationships.
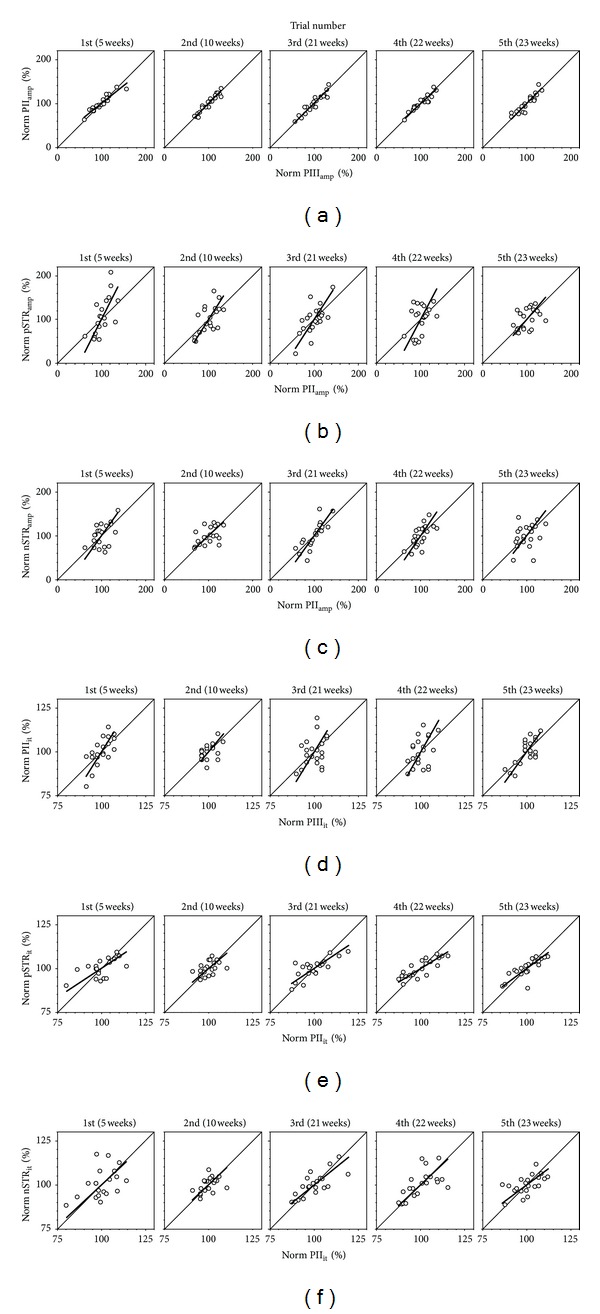
Methods: Regression analyses between two serial ERG parameters in a control cohort of rats are used to define gain relationships. These gains are then applied to two models of retinal disease.
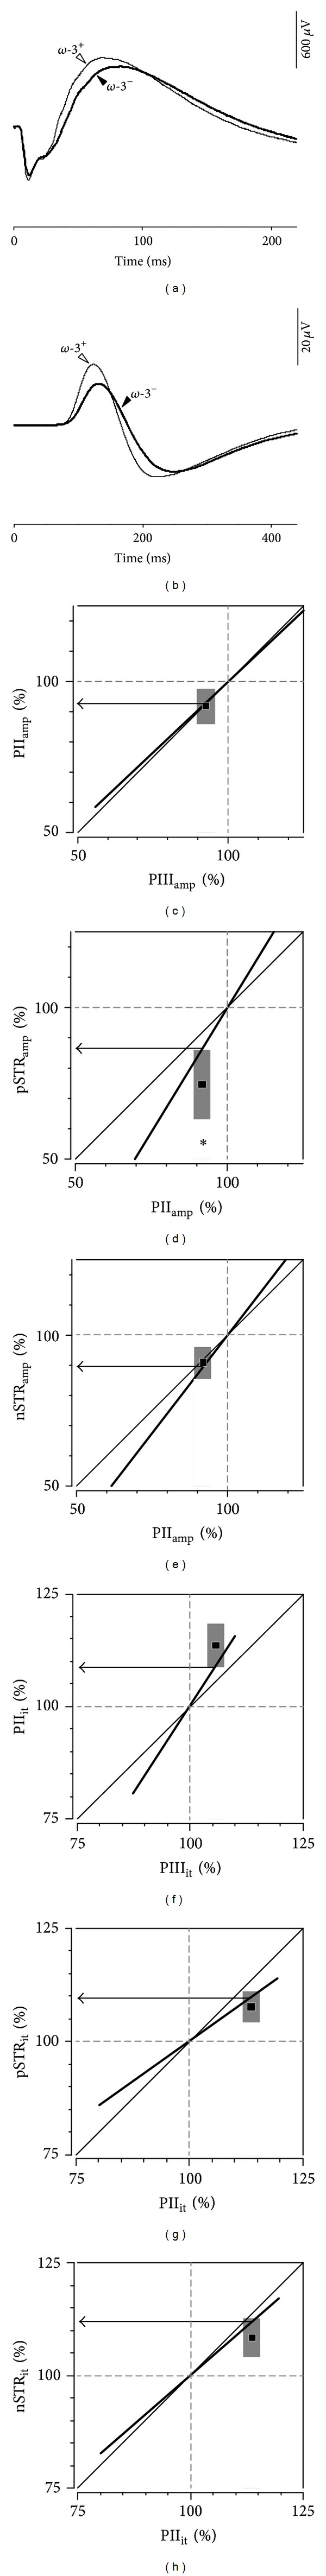
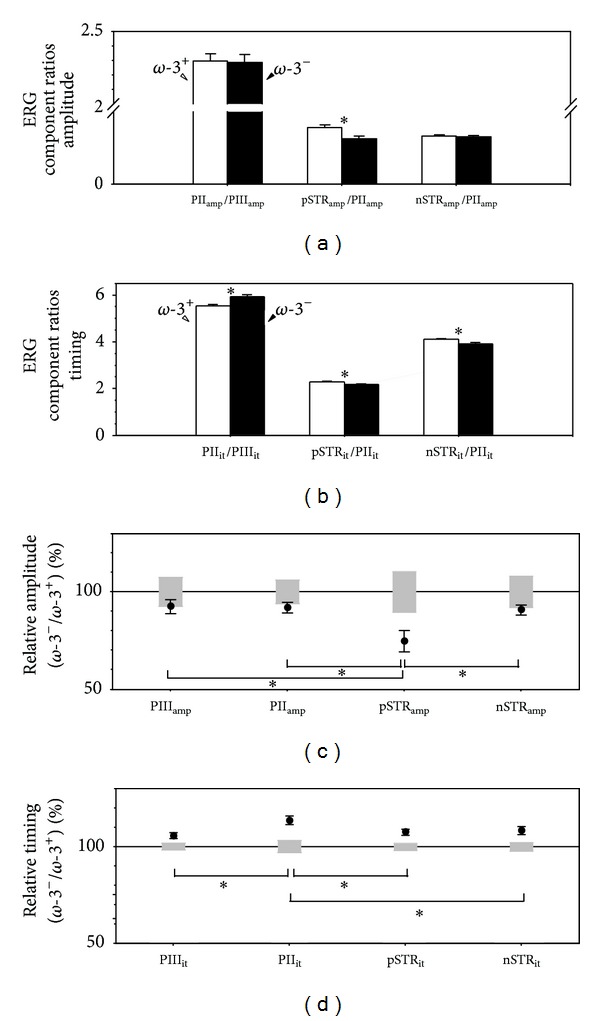
Results: The PIII(amp) to PII(amp) gain is unity whereas the PII(amp) to pSTR(amp) and PII(amp) to nSTR(amp) gains are greater than unity, indicating "amplification" (P < 0.05). Timing relationships show amplification between PIII(it) to PII(it) and compression for PII(it) to pSTR(it) and PII(it) to nSTR(it), (P < 0.05). Application of these gains to ω-3-deficiency indicates that all timing changes are downstream of photoreceptor changes, but a direct pSTR amplitude loss occurs (P < 0.05). Application to diabetes indicates widespread inner retinal dysfunction which cannot be attributed to outer retinal changes (P < 0.05).
Conclusions: This simple approach aids in the interpretation of inner retinal ERG changes by taking into account gain characteristics found between successive ERG components of normal animals.
Figures
Similar articles
-
Dietary omega-3 fatty acids and ganglion cell function.Invest Ophthalmol Vis Sci. 2008 Aug;49(8):3586-94. doi: 10.1167/iovs.08-1735. Epub 2008 May 9. Invest Ophthalmol Vis Sci. 2008. PMID: 18469188
-
The scotopic threshold response of the dark-adapted electroretinogram of the mouse.J Physiol. 2002 Sep 15;543(Pt 3):899-916. doi: 10.1113/jphysiol.2002.019703. J Physiol. 2002. PMID: 12231647 Free PMC article.
-
PII component of the toad electroretinogram.J Neurophysiol. 1992 Jul;68(1):333-41. doi: 10.1152/jn.1992.68.1.333. J Neurophysiol. 1992. PMID: 1517826
-
Intraretinal analysis of the threshold dark-adapted ERG of cat retina.J Neurophysiol. 1989 Jun;61(6):1221-32. doi: 10.1152/jn.1989.61.6.1221. J Neurophysiol. 1989. PMID: 2746322
-
Analysis of pharmacologically isolated components of the ERG.Vision Res. 1999 May;39(10):1759-66. doi: 10.1016/s0042-6989(98)00281-8. Vision Res. 1999. PMID: 10343867
Cited by
-
Tyro3 Contributes to Retinal Ganglion Cell Function, Survival and Dendritic Density in the Mouse Retina.Front Neurosci. 2020 Aug 14;14:840. doi: 10.3389/fnins.2020.00840. eCollection 2020. Front Neurosci. 2020. PMID: 32922258 Free PMC article.
-
Full-field electroretinogram in autism spectrum disorder.Doc Ophthalmol. 2016 Apr;132(2):83-99. doi: 10.1007/s10633-016-9529-y. Epub 2016 Feb 11. Doc Ophthalmol. 2016. PMID: 26868825
-
Retinal alpha-synuclein accumulation correlates with retinal dysfunction and structural thinning in the A53T mouse model of Parkinson's disease.Front Neurosci. 2023 May 5;17:1146979. doi: 10.3389/fnins.2023.1146979. eCollection 2023. Front Neurosci. 2023. PMID: 37214398 Free PMC article.
-
The Effect of Aging on Retinal Function and Retinal Ganglion Cell Morphology Following Intraocular Pressure Elevation.Front Aging Neurosci. 2022 May 12;14:859265. doi: 10.3389/fnagi.2022.859265. eCollection 2022. Front Aging Neurosci. 2022. PMID: 35645783 Free PMC article.
-
Functional Analysis and Immunochemical Analyses of Ca2+ Homeostasis-Related Proteins Expression of Glaucoma-Induced Retinal Degeneration in Rats.Exp Neurobiol. 2018 Feb;27(1):16-27. doi: 10.5607/en.2018.27.1.16. Epub 2018 Feb 20. Exp Neurobiol. 2018. PMID: 29535566 Free PMC article.
References
-
- Wassle H. Parallel processing in the mammalian retina. Nature Reviews Neuroscience. 2004;5(10):747–757. - PubMed
-
- Frishman LJ. Origins of the electroretinogram. In: Heckenlively JR, Arden GB, editors. Principles and Practice of Clinical Electrophysiology of Vision. London, UK: The Mit Press; 2006. pp. 139–185.
-
- Weymouth AE, Vingrys AJ. Rodent electroretinography: methods for extraction and interpretation of rod and cone responses. Progress in Retinal and Eye Research. 2008;27(1):1–44. - PubMed
-
- Hood DC, Bircht DG. The A-wave of the human electroretinogram and rod receptor function. Investigative Ophthalmology and Visual Science. 1990;31(10):2070–2081. - PubMed
Publication types
MeSH terms
Substances
LinkOut - more resources
Full Text Sources
Other Literature Sources
