Review
. 2013 Oct;40(10):100901.
doi: 10.1118/1.4820371.

Vision 20/20: Single photon counting x-ray detectors in medical imaging

Affiliations
Review

Vision 20/20: Single photon counting x-ray detectors in medical imaging

Katsuyuki Taguchi et al. Med Phys. 2013 Oct.

Abstract

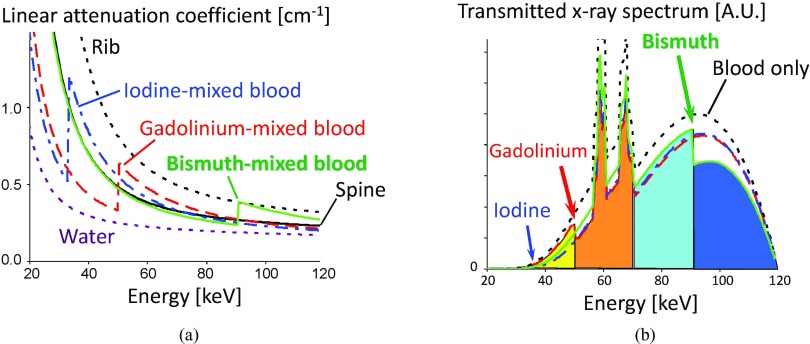
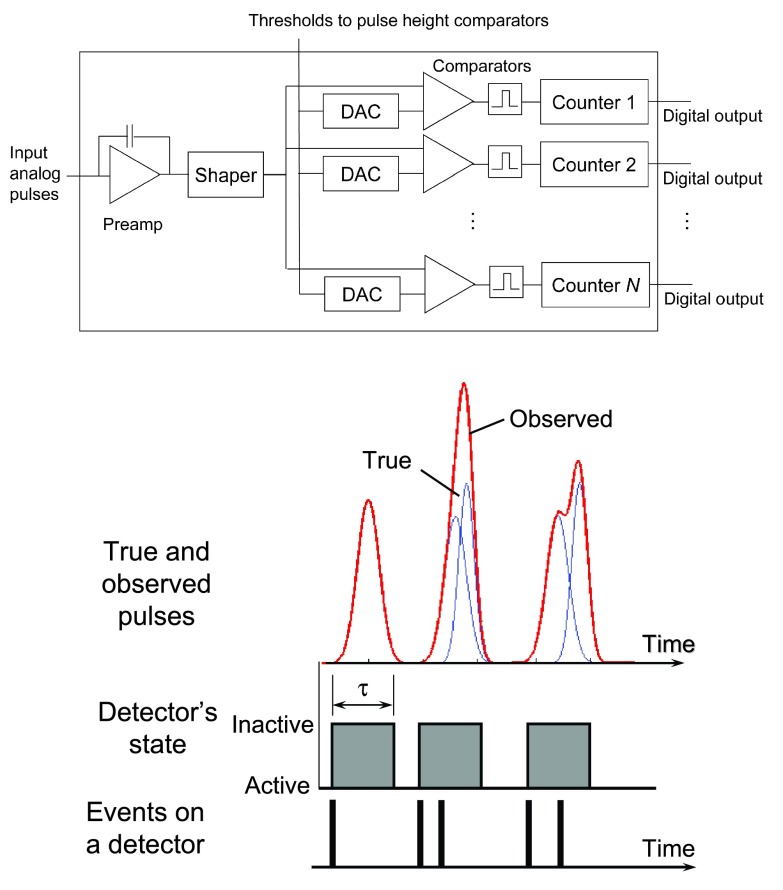
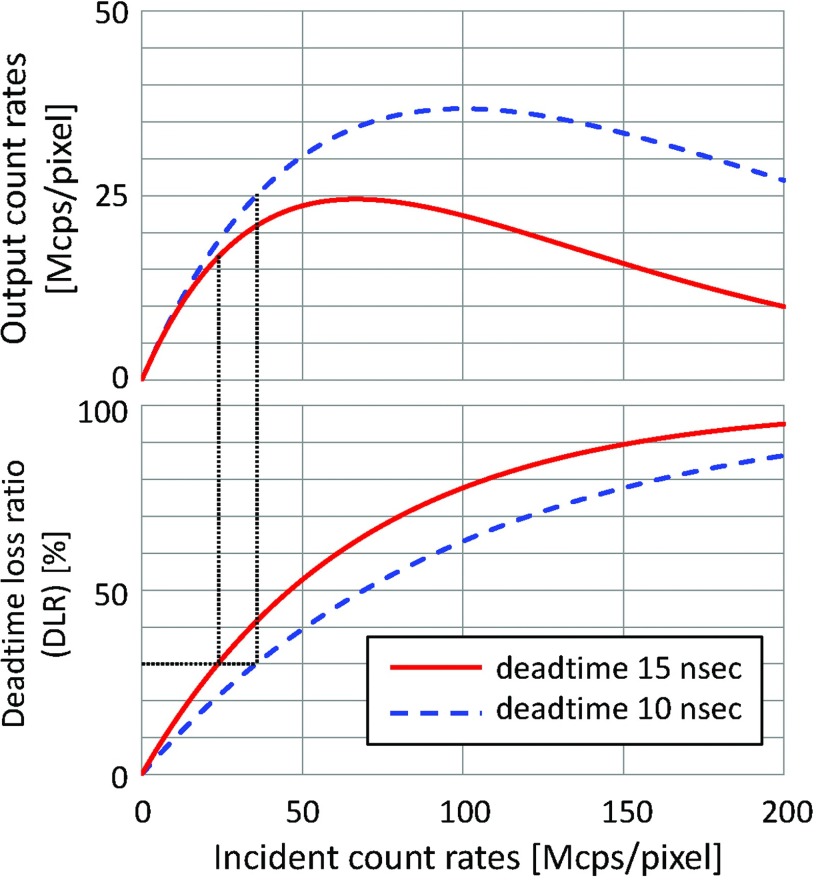
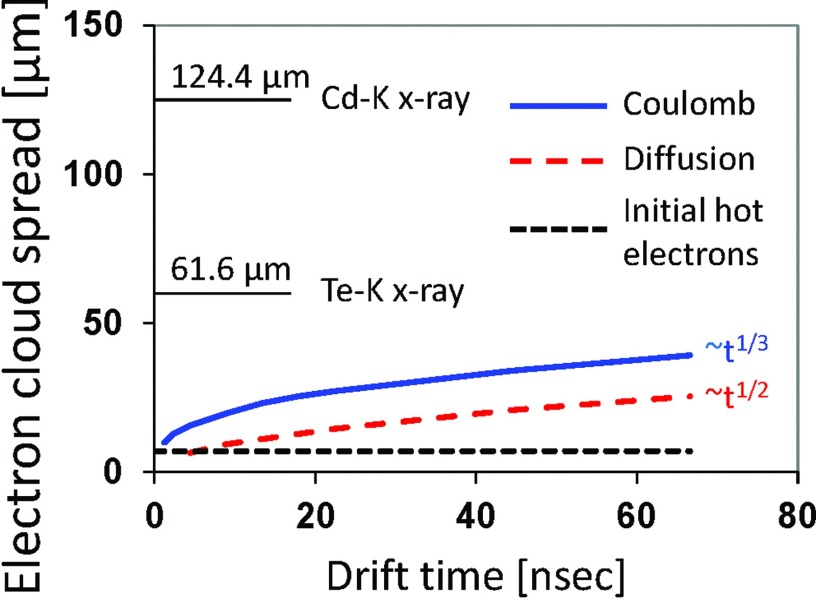
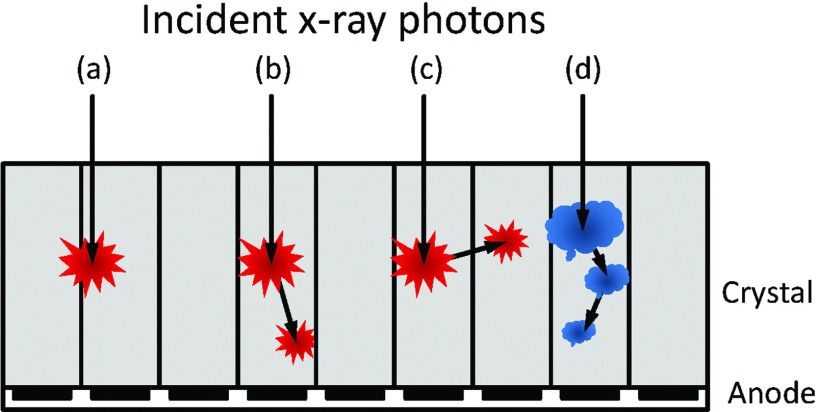
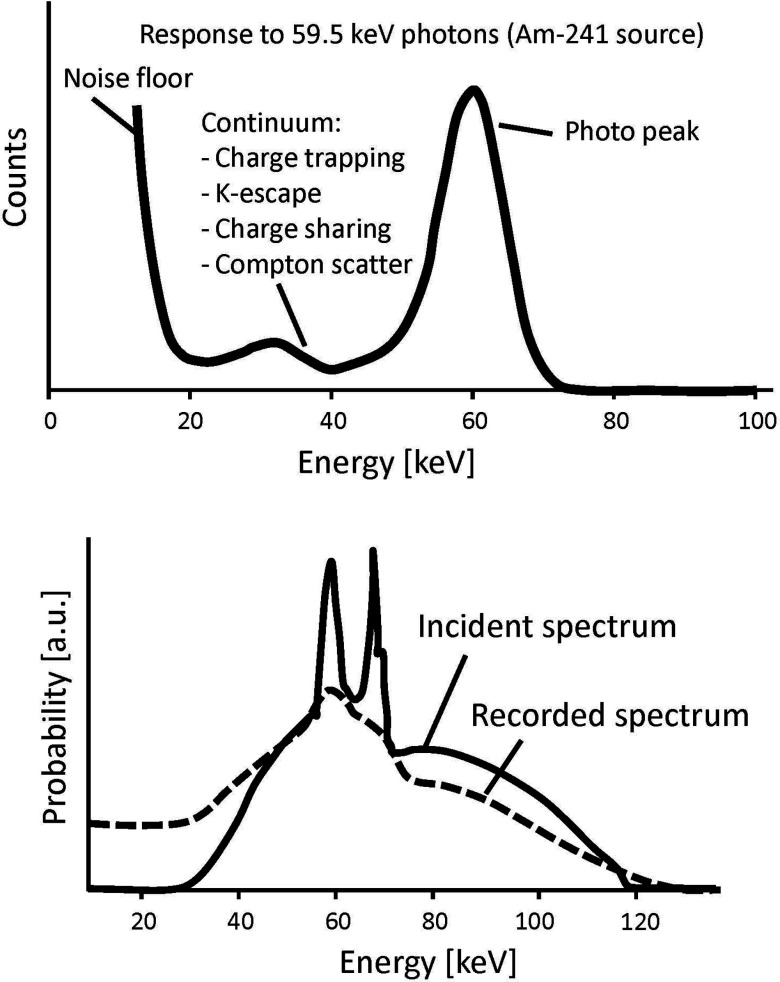
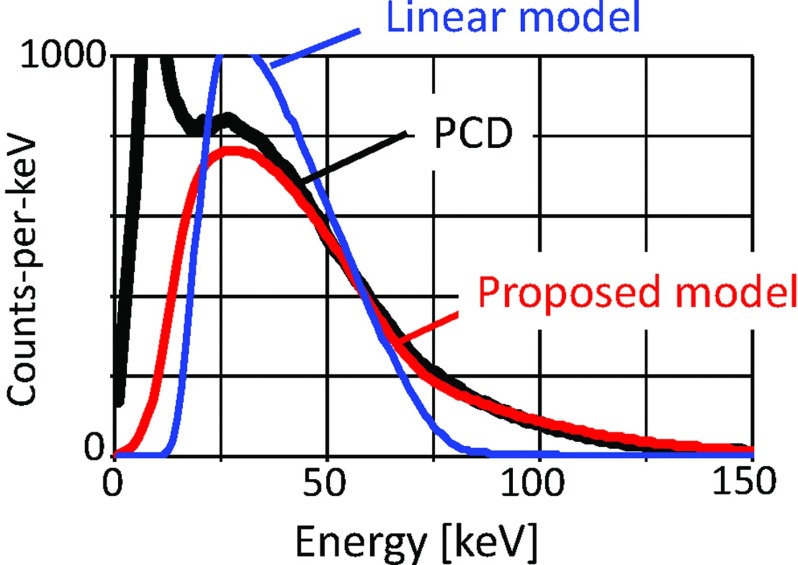
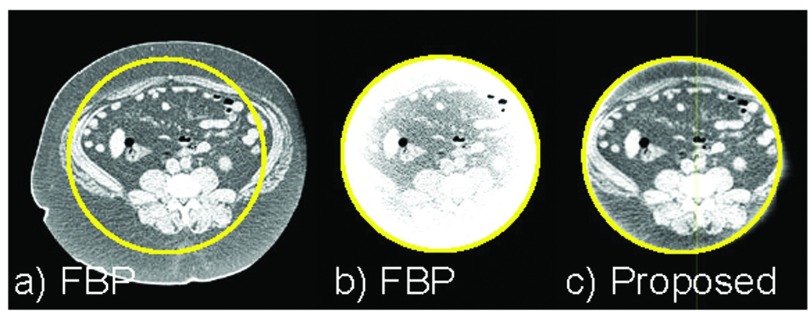
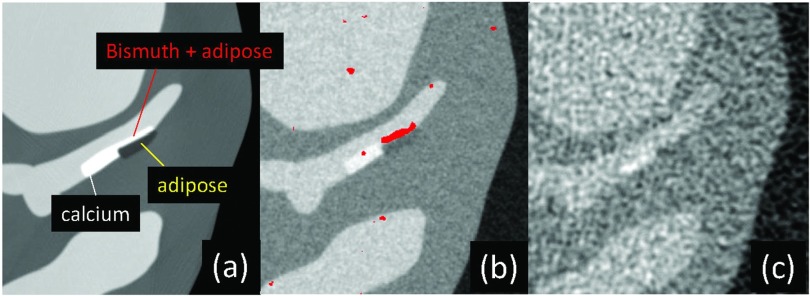
Photon counting detectors (PCDs) with energy discrimination capabilities have been developed for medical x-ray computed tomography (CT) and x-ray (XR) imaging. Using detection mechanisms that are completely different from the current energy integrating detectors and measuring the material information of the object to be imaged, these PCDs have the potential not only to improve the current CT and XR images, such as dose reduction, but also to open revolutionary novel applications such as molecular CT and XR imaging. The performance of PCDs is not flawless, however, and it seems extremely challenging to develop PCDs with close to ideal characteristics. In this paper, the authors offer our vision for the future of PCD-CT and PCD-XR with the review of the current status and the prediction of (1) detector technologies, (2) imaging technologies, (3) system technologies, and (4) potential clinical benefits with PCDs.


Figures

Figure 1
Figure 1
(Left) Energy-dependent linear attenuation coefficients of various materials. Contrasts between different materials are larger at lower energies in general. Four materials, spine, 0.49% w/w iodine-mixed blood, 0.26% w/w gadolinium-mixed blood, and 0.28% w/w bismuth-mixed blood, would result in the same pixel value with the current EID-CT, although they have distinctly different attenuation curves. (Right) Transmitted spectra with 25 cm water and 5 cm blood without or with one of the three contrast agents. The K-edges of gadolinium and bismuth are clearly seen.
Figure 2
Figure 2
(Top) The basic architecture of an individual channel with N energy thresholds in the ASIC. (Bottom) Each photon incident on a detector will generate a pulse whose height is associated with the photon energy. Quasicoincident photons within the detector deadtime τ are counted as 1 event with different energies from the originals due to pulse pileup effects. The former will result in lost counts and the latter in a distorted recorded energy spectrum.
Figure 3
Figure 3
Output count rates [million counts per second per detector pixel, Mcps/pixel] and DLR [%] of paralyzable detectors plotted over true count rates. For a peaking time of 5 ns or larger (see discussion in Sec. 2D), the minimum deadtime is 10–15 ns. To limit the DLR up to 30% (see Sec. 2D), the true count rates must be under 23.8 and 35.7 Mcps/pixel for 15 and 10 ns detector, respectively, which means that the theoretical maximum output count rates will be 16.6 and 25.0 Mcps/pixel, respectively.
Figure 4
Figure 4
Factors contributing to the spread of an electron cloud. Coulomb and diffusion contributions were calculated as a function of electron drift time assuming an electric field of E = 3333 V/cm and photon energy of 70 keV. It takes ∼70 ns for an electron charge cloud to travel 3 mm in a CdTe layer. For reference, the mean absorption ranges of Cd-K and Te-K x-rays (discussed in Secs. 2C3, 2D) are 124.4 and 61.6 μm, respectively. Characteristic K x-rays ranges are calculated for the averaged energies of K-alpha 1 and K-alpha 2 because they are most prevalent. However, K x-rays ranges for K-betas are slightly longer because their energies are higher. Interest readers should consult Ref. for more discussion. More analysis on the electron cloud spread due to Coulomb force and diffusion can be found, e.g., in Refs. and , respectively.
Figure 5
Figure 5
Various interactions between incident x-ray photons and PCDs. (a) An interaction near pixel boundaries will be detected by multiple adjacent pixels (charge sharing). (b) The photoelectric effect results in a K-escape characteristic x-ray of the PCD sensor material, which is absorbed by the same pixel and results in quasicoincident events. (c) A K-escape x-ray is absorbed by another pixel, resulting in a loss of energy. (d) Multiple Compton scattering results in multiple quasicoincident events. A part of the signal may be detected by adjacent pixels.
Figure 6
Figure 6
(Left) Count rates of a typical cardiac CT scan shown in sinogram. (Right) XCAT phantom.
Figure 7
Figure 7
Calculated true count rates in the lateral view of an elliptic water phantom when it is off-centered by 5 cm. Dynamic and stationary bowtie filters (left) decrease the count rates near the edges of the object (right, red curve), compared to the results without the dynamic filters (blue curve).
Figure 8
Figure 8
The model of forward imaging process used in maximum likelihood methods to compensate for various spectral degradation factors.
Figure 9
Figure 9
(Top) An illustration of a typical spectrum recorded by a PCD using Am-241. The spectrum is distorted even at a very low count rate (i.e., the pulse pileup effects are minimal). (Bottom) There is a significant discrepancy between the true and recorded polychromatic x-ray spectra.
Figure 10
Figure 10
The spectrum recorded by a PCD was severely distorted by pulse pileup effects and there is a significant discrepancy from the spectrum predicted by a linear model (i.e., the true spectrum linearly scaled by the deadtime loss ratio). In contrast, the PCD model proposed in Ref. accurately estimated the recorded spectrum. The coefficient of variation was as small as 7.2%, while the deadtime loss ratio was as much as 46%. Reprinted with a modification from K. Taguchi, et al., “Modeling the performance of a photon counting x-ray detector for CT: Energy response and pulse pileup effects,” Med. Phys. 38, 1089–1102 (2011) (Ref. 84).
Figure 11
Figure 11
Reconstructed images (a) without or (b) and (c) with truncation outside the circle, using (a) and (b) filtered backprojection or (c) the proposed sequential method. The image reconstructed by the proposed method showed very little bias throughout the region-of-interest except near the edge of the region-of-interest, while the image appeared very similar to that reconstructed without truncation. Reprinted with a modification from K. Taguchi, et al., “Interior region-of-interest reconstruction using a small, nearly piecewise constant subregion,” Med. Phys. 38, 1307–1312 (2011) (Ref. 96).
Figure 12
Figure 12
(a) A computer simulated XCAT phantom image with bismuth at the surface of fatty atherosclerosis in a coronary artery (a). (b) and (c) Reconstructed images of the phantom scanned at the equivalent dose using a PCD-CT (b) and an EID-CT (c). Densities of bismuth are shown in red in (b). The PCD image has a better contrast-to-noise ratio and appears sharper than the EID image. This is also an example of K-edge, molecular, and simultaneous multiagent imaging. Reprinted with a modification from J. Cammin, et al., “Spectral response compensation for photon counting clinical x-ray CT and application to coronary vulnerable plaque detection,” Proceedings of the Second International Meeting on Image Formation in X-Ray Computed Tomography, edited by F. Noo (Salt Lake City, UT, 2012) pp. 186–189 (Ref. 113).

References

    1. F. A.Mettler, Jr., Wiest P. W., Locken J. A., and Kelsey C. A., “CT scanning: Patterns of use and dose,” J. Radiol. Prot. 20, 353–359 (2000).10.1088/0952-4746/20/4/301 - DOI - PubMed
    1. Swank R. K., “Absorption and noise in x-ray phosphors,” J. Appl. Phys. 44, 4199–4203 (1973).10.1063/1.1662918 - DOI
    1. Alvarez R. E. and Macovski A., “Energy-selective reconstructions in x-ray computerised tomography,” Phys. Med. Biol. 21, 733–744 (1976).10.1088/0031-9155/21/5/002 - DOI - PubMed
    1. Yu L., Primak A. N., Liu X., and McCollough C. H., “Image quality optimization and evaluation of linearly mixed images in dual-source, dual-energy CT,” Med. Phys. 36, 1019–1024 (2009).10.1118/1.3077921 - DOI - PMC - PubMed
    1. Iwanczyk J. S., Nygard E., Meirav O., Arenson J., Barber W. C., Hartsough N. E., Malakhov N., and Wessel J. C., “Photon counting energy dispersive detector arrays for x-ray imaging,” IEEE Trans. Nucl. Sci. 56, 535–542 (2009).10.1109/TNS.2009.2013709 - DOI - PMC - PubMed

Publication types