

Power spectrum analysis of the x-ray scatter signal in mammography and breast tomosynthesis projections
- PMID: 24089907
- PMCID: PMC3785536
- DOI: 10.1118/1.4820442
Power spectrum analysis of the x-ray scatter signal in mammography and breast tomosynthesis projections
Abstract
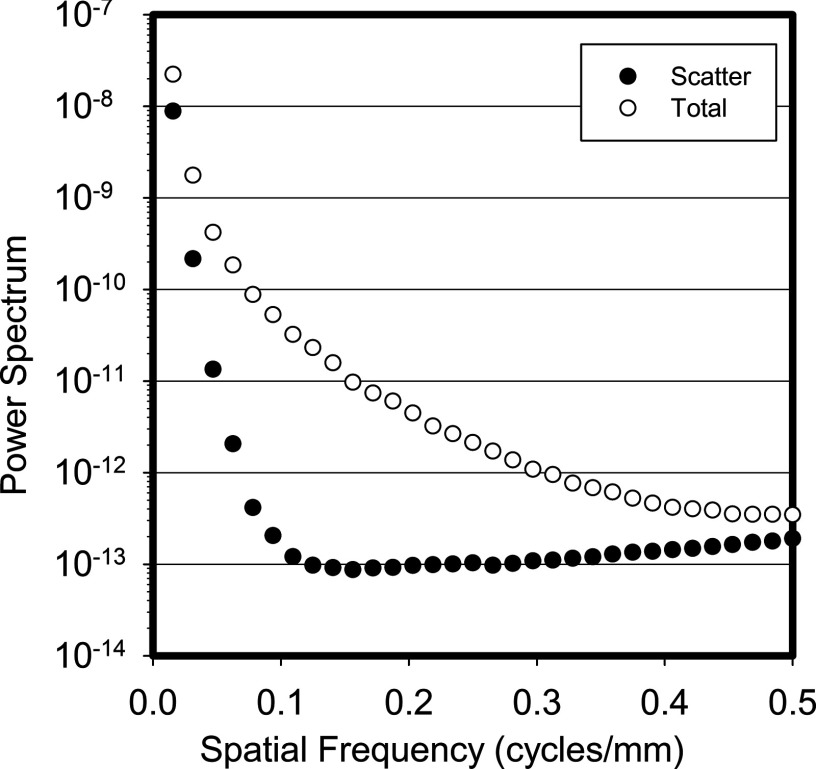
Purpose: To analyze the frequency domain characteristics of the signal in mammography images and breast tomosynthesis projections with patient tissue texture due to detected scattered x-rays.
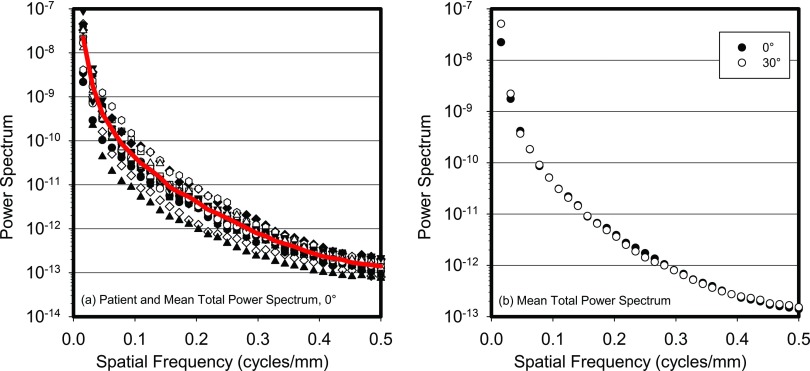
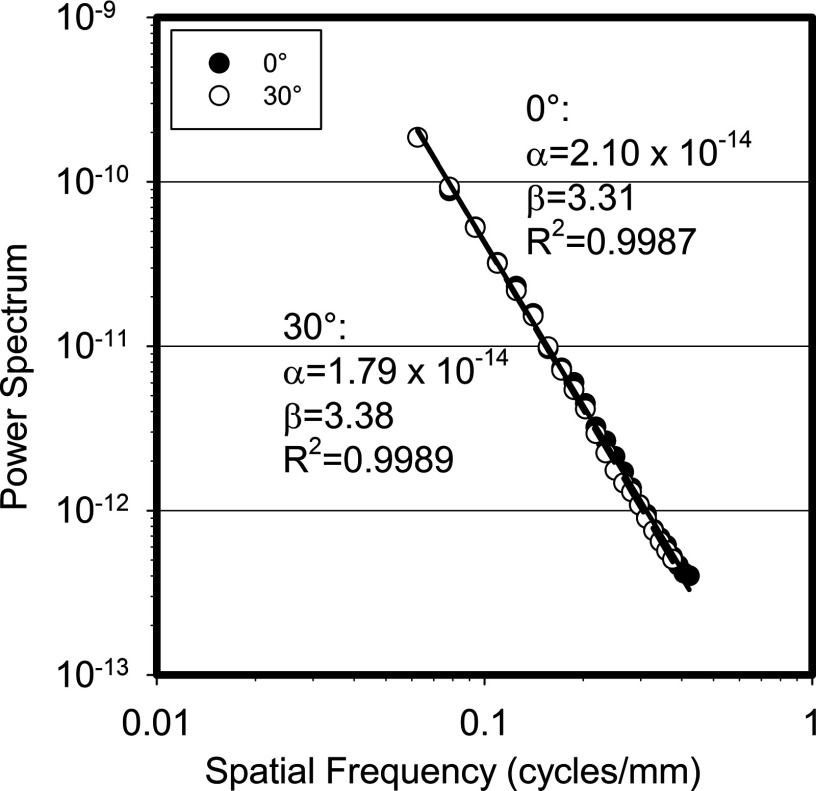
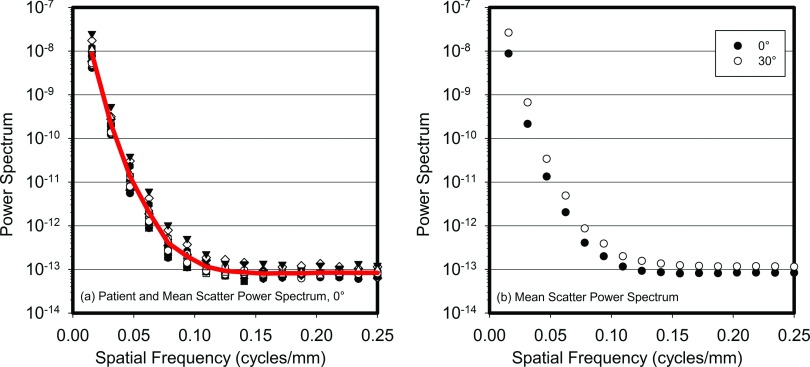
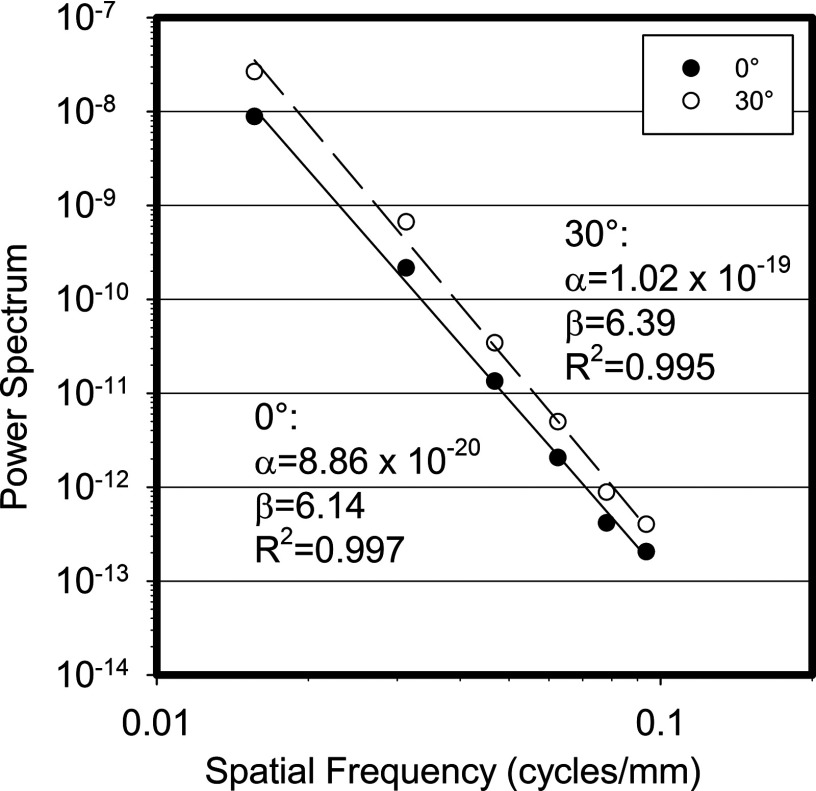
Methods: Acquisitions of x-ray projection images of 19 different patient breasts were simulated using previously acquired volumetric patient images. Acquisition of these images was performed with a dedicated breast CT prototype system, and the images were classified into voxels representing skin, adipose, and glandular tissue with a previously validated automated algorithm. The classified three dimensional images then underwent simulated mechanical compression representing that which is performed during acquisition of mammography and breast tomosynthesis images. The acquisition of projection images of each patient breast was simulated using Monte Carlo methods with each simulation resulting in two images: one of the primary (non-scattered) signal and one of the scatter signal. To analyze the scatter signal for both mammography and breast tomosynthesis, two projections images of each patient breast were simulated, one with the x-ray source positioned at 0° (mammography and central tomosynthesis projection) and at 30° (wide tomosynthesis projection). The noise power spectra (NPS) for both the scatter signal alone and the total signal (primary + scatter) for all images were obtained and the combined results of all patients analyzed. The total NPS was fit to the expected power-law relationship NPS(f) = k/f β and the results were compared with those previously published on the power spectrum characteristics of mammographic texture. The scatter signal alone was analyzed qualitatively and a power-law fit was also performed.
Results: The mammography and tomosynthesis projections of three patient breasts were too small to analyze, so a total of 16 patient breasts were analyzed. The values of β for the total signal of the 0° projections agreed well with previously published results. As expected, the scatter power spectrum reflected a fast drop-off with increasing spatial frequency, with a reduction of four orders of magnitude by 0.1 lp/mm. The β values for the scatter signal were 6.14 and 6.39 for the 0° and 30° projections, respectively.
Conclusions: Although the low-frequency characteristics of scatter in mammography and breast tomosynthesis were known, a quantitative analysis of the frequency domain characteristics of this signal was needed in order to optimize previously proposed software-based x-ray scatter reduction algorithms for these imaging modalities.
Figures
References
-
- Liu B., Wu T., Moore R. H., and Kopans D. B., “Monte Carlo simulation of x-ray scatter based on patient model from digital breast tomosynthesis,” Proc. SPIE 6142, 61421N–61429N (2006). 10.1117/12.650193 - DOI
-
- Hogge J. P., Palmer C. H., Muller C. C., Little S. T., Smith D. C., Fatouros P. P., and de Paredes E. S., “Quality assurance in mammography: Artifact analysis,” Radiographics 19, 503–522 (1999). - PubMed
Publication types
MeSH terms
Grants and funding
LinkOut - more resources
Full Text Sources
Other Literature Sources
Medical
Research Materials
