. 2013 Aug 31:8:30.
doi: 10.1186/1750-1326-8-30.

Amyotrophic lateral sclerosis-linked FUS/TLS alters stress granule assembly and dynamics

Affiliations

Amyotrophic lateral sclerosis-linked FUS/TLS alters stress granule assembly and dynamics

Desiree M Baron et al. Mol Neurodegener. .

Abstract

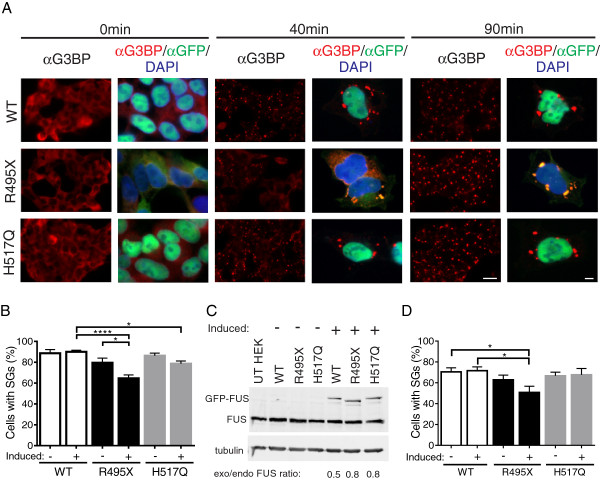
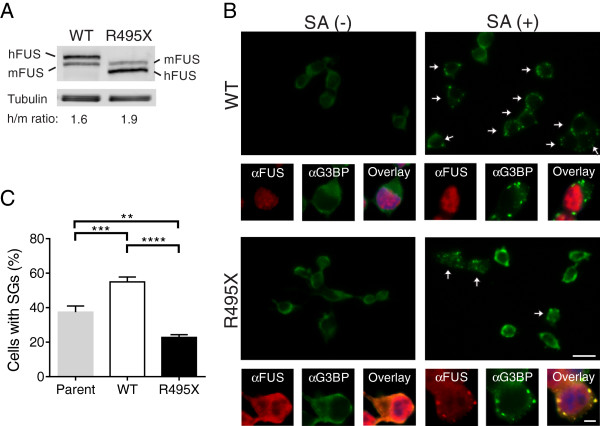
Background: Amyotrophic lateral sclerosis (ALS)-linked fused in sarcoma/translocated in liposarcoma (FUS/TLS or FUS) is concentrated within cytoplasmic stress granules under conditions of induced stress. Since only the mutants, but not the endogenous wild-type FUS, are associated with stress granules under most of the stress conditions reported to date, the relationship between FUS and stress granules represents a mutant-specific phenotype and thus may be of significance in mutant-induced pathogenesis. While the association of mutant-FUS with stress granules is well established, the effect of the mutant protein on stress granules has not been examined. Here we investigated the effect of mutant-FUS on stress granule formation and dynamics under conditions of oxidative stress.

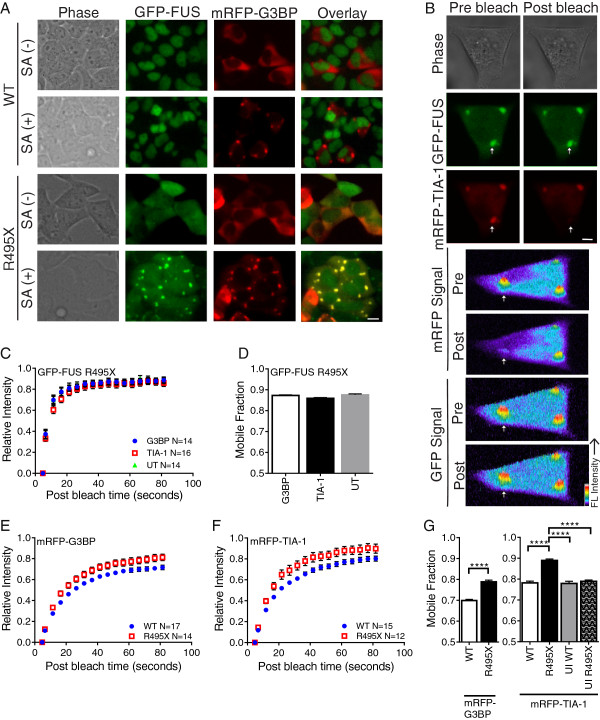
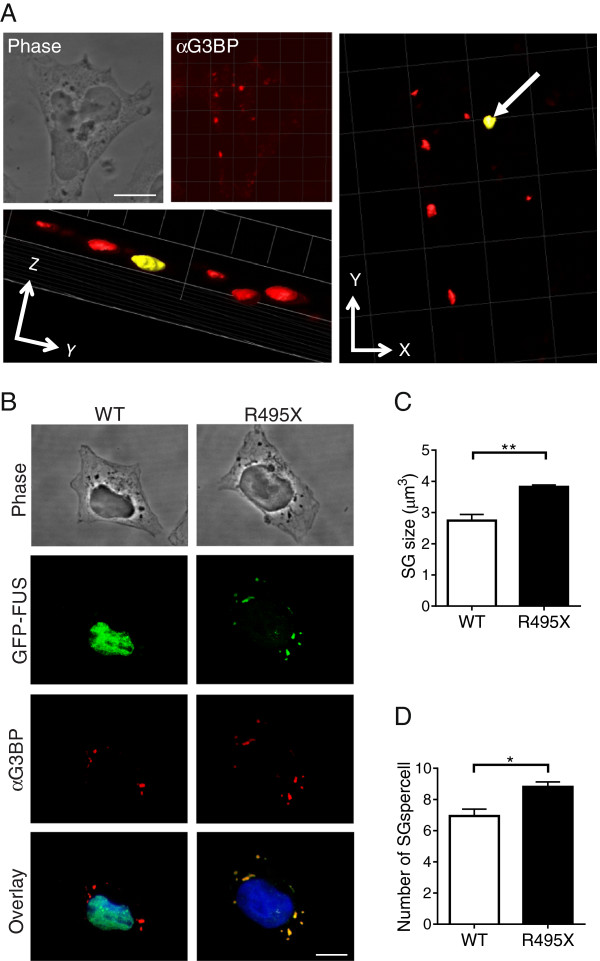
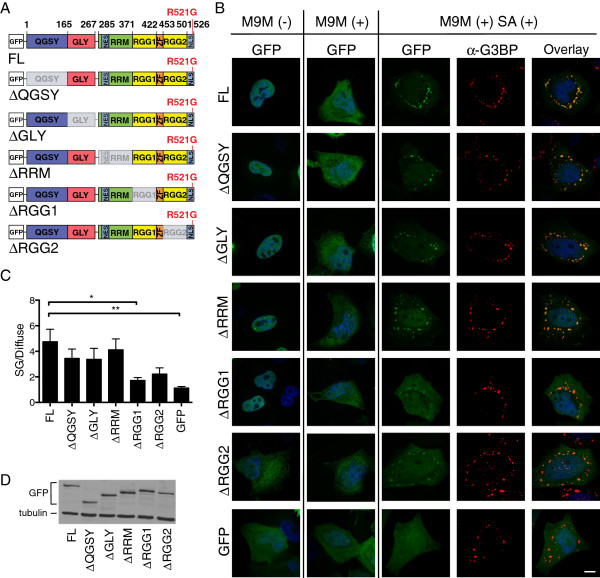
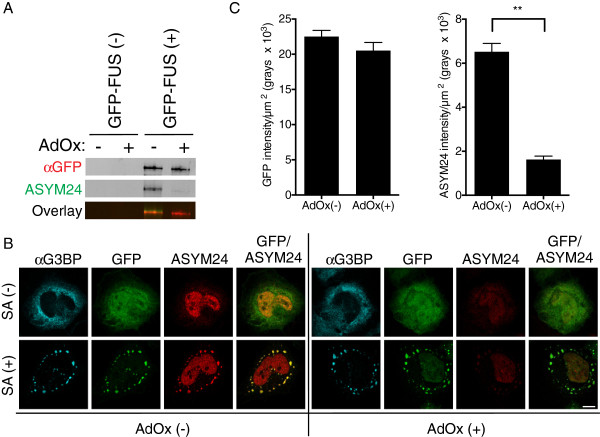
Results: We found that expression of mutant-FUS delays the assembly of stress granules. However, once stress granules containing mutant-FUS are formed, they are more dynamic, larger and more abundant compared to stress granules lacking FUS. Once stress is removed, stress granules disassemble more rapidly in cells expressing mutant-FUS. These effects directly correlate with the degree of mutant-FUS cytoplasmic localization, which is induced by mutations in the nuclear localization signal of the protein. We also determine that the RGG domains within FUS play a key role in its association to stress granules. While there has been speculation that arginine methylation within these RGG domains modulates the incorporation of FUS into stress granules, our results demonstrate that this post-translational modification is not involved.

Conclusions: Our results indicate that mutant-FUS alters the dynamic properties of stress granules, which is consistent with a gain-of-toxic mechanism for mutant-FUS in stress granule assembly and cellular stress response.


Figures

Figure 1
Figure 1
Mutant-FUS expression delays the assembly and expedites the disassembly of stress granules in human cells. (A) Representative fluorescence images of HEK-293 cells expressing GFP-FUS (WT, R495X or H517Q) upon treatment with 0.25 mM sodium arsenite for 0, 40 and 90 min. The extent of stress granule formation in each line is illustrated with low magnification (40x) images using the anti-G3BP (red) stress granule marker (columns 1, 3 and 5). The localization of GFP-FUS (green) with respect to the nuclei (DAPI; blue) and stress granules is demonstrated within high magnification (100x) images (columns 2, 4 and 6). Scale bar = 20 and 5 μm, respectively, in low and high magnification images. (B) Quantification of the percentage of cells with stress granules at 40 min for the lines in (A) that are either induced (+) or not induced (−) to express GFP-FUS reveal that expression of GFP-FUS R495X causes a significant decrease in the number of cells with stress granules compared to controls. All error bars represent SEMs. Statistically significant differences were determined by one-way ANOVA and Tukey’s post-hoc test (****P < 0.0001, *P < 0.05). Additional significant comparisons include, but are not shown for clarity: uninduced GFP-FUS WT versus induced GFP-FUS R495X (P <0.001), uninduced GFP-FUS H517Q versus induced GFP-FUS R495X (P <0.001), and induced GFP-FUS H517Q versus induced GFP-FUS R495X (P < 0.01). (C) Western blot and densitometry analyses of cell lines in (B) and naive HEK-293 cells (UT) reveal that exogenous (exo) GFP-FUS proteins are expressed at levels similar to each other and within 2-fold of endogenous (endo) FUS (exo/endo FUS ratio). (D) Stress granule disassembly was assessed as described in (B) for GFP-FUS WT, R495X and H517Q lines after stress was removed for 90 min. Significantly fewer GFP-FUS R495X expressing cells contain stress granules.
Figure 2
Figure 2
Expression of the FUS R495X mutant interferes with stress granule assembly in neuronal cells. (A) Exogenous human (h) FUS proteins are similar to each other and within 2-fold of endogenous mouse (m) FUS as determined by western blot and densitometry analyses. The ratio of hFUS/mFUS proteins is indicated for each cell line. (B) Immunofluorescence images of NSC-34 cells expressing untagged FUS (WT and R495X) either in the absence (−) or presence (+) of 0.25 mM sodium arsenite (SA) for 1 hr. Low magnification (40x) images of SA (+) treated cells using the anti-G3BP stress granule marker (green) show a greater number of stress granule-positive cells (denoted by arrows) in the FUS WT line compared to the FUS R495X line. High magnification (100X) images showing a single cell reveal the localization of FUS (red) and G3BP (note: the far red channel was used for detection of G3BP and the images are shown in green for clarity) under all conditions. DAPI (nuclei) is included in the overlay images. Note that in cells with stress granules, cytoplasmic R495X co-localizes to these structures as expected (see overlay image in bottom right). Scale bar = 20 and 5 μm, respectively, in low and high magnification images. (C) Quantitative analysis (as described in Figure 1B) of the percentage of NSC-34 cells with stress granules after 1 hr of sodium arsenite treatment revealed that expression of FUS R495X inhibited stress granule assembly compared to cells expressing FUS WT and the parent line. All error bars represent SEMs. Statistically significant differences were determined by one-way ANOVA and Tukey’s post-hoc test (****P < 0.0001, ***P < 0.001, **P < 0.01).
Figure 3
Figure 3
GFP-FUS R495X is weakly bound to stress granules and alters binding of stress granule-associated proteins. (A) Live cell images of GFP-FUS (WT and R495X) expressing HEK-293 cells transfected with mRFP-G3BP. Images are shown before (−) and after (+) treatment with 0.2 mM sodium arsenite (SA) for 1 hr. Scale bar = 10 μm. (B) Top three panels: exemplar GFP and mRFP images of a SA treated cell for a mRFP-TIA-1 FRAP experiment before and after photobleaching. The mRFP signal, but not GFP signal, is lost from the stress granule (indicated by arrow). Scale bar = 5 μm. Bottom four panels: fluorescence intensity profiles corresponding to the above panels (rotated 90° clockwise). (C) The recovery curve for GFP-FUS R495X in untransfected (UT; green triangle) cells are indicative of fast fluorescence recovery. The GFP-FUS R495X profile does not change upon transfection with either mRFP-G3BP (blue circle) or mRFP-TIA-1 (red square). (D) Nearly identical mobile fractions support the conclusions in (C). (E & F) Recovery curves for mRFP-G3BP (E) and mRFP-TIA-1 (F) differ for GFP-FUS WT (blue circle) and R495X (red square) expressing cells. (G) Mobile fractions for the curves in (E & F) are significantly higher for GFP-FUS R495X (black bars) relative to GFP-FUS WT (white bars) cells. Mobile fractions for mRFP-TIA-1 are the same for the following control experiments: GFP-FUS WT expressing cells (white bars), uninduced (UI) GFP-FUS WT cells (grey bar) and uninduced GFP-FUS R495X cells (hatched bar). Asterisks indicate statistically significant differences between cell lines as determined by two-way ANOVA and Tukey’s post-hoc test (****P < 0.0001) on data from at least n=2 independent experiments. All error bars represent SEMs. The total number (N) of stress granule analyzed is indicated on the recovery panels.
Figure 4
Figure 4
Stress granule size and number are increased in GFP-FUS R495X expressing cells. (A) Clockwise order: representative single-plane phase (top left) and anti-G3BP (stress granule marker; red) immunofluorescence (top middle) confocal images of an HEK-293 cell expressing GFP-FUS WT treated with 0.5 mM sodium arsenite for 1 hr. Three-dimensional (3D) reconstruction was used to quantify stress granule volume (see Materials and methods, and C within this figure). The xy (right) and yz (bottom; view along arrow in xy image) planes for this 3D reconstructed image are shown; the stress granule highlighted in yellow is marked for volume analysis. Scale bar = 10 μm. (B) Representative maximum projection confocal images of GFP-FUS WT and GFP-FUS R495X expressing cells treated as in (A) exemplify the size and number of stress granules for each line. Scale bar = 10 μm. (C and D) GFP-FUS R495X expressing cells contain stress granules with larger volume (C) and in greater abundance (D) relative to cells expressing GFP-FUS WT. Asterisks indicate statistically significant differences between cell lines as determined by the Student’s t-test (**P < 0.01, *P < 0.05) on data from n=3 independent experiments. All error bars represent SEMs.
Figure 5
Figure 5
The RGG domains modulate the incorporation of FUS into arsenite-induced stress granules. (A) Illustration of full length (FL) GFP-FUS R521G and constructs lacking the following sequences: Gln-Gly-Ser-Tyr-rich (∆QGSY), Gly-rich (∆GLY), RNA recognition motif (∆RRM), and Arg-Gly-Gly-rich (RGG) regions (∆RGG1 and ∆RGG2). (B) Confocal images of HeLa cells transfected with GFP-FUS R521G constructs (green) alone (−) or co-transfected (+) with MBP-M9M, the transportin-1 inhibitor. Note the increased levels of cytoplasmic GFP-FUS in co-transfected cells (compare columns 1 and 2). Confocal fluorescence images of co-transfected cells treated with 0.5 mM sodium arsenite for 1 hr were used to assess the ability of GFP-FUS R521G constructs (green; column 3) to associate with stress granules (G3BP; red; column 4). The greatest degree of GFP and G3BP co-localization was observed in cells expressing FL GFP-FUS R521G, whereas there was minimal co-localization in control cells expressing free GFP (compare panels in column 5). (C) Quantitative analysis (see Materials and methods) of (B) reveals that constructs lacking RGG domains (∆RGG1 and ∆RGG2) exhibit impaired localization to stress granules. Statistically significant comparisons include FL and ∆RGG1 (*P < 0.05), FL and GFP (**P < 0.01), and ∆QGSY and GFP (*P < 0.05; not shown on graph for clarity) by one-way ANOVA followed by a Dunnett’s post-hoc test on n=3 independent experiments. All error bars represent SEMs. (D) Western blot analysis of HeLa cells in (B) demonstrates equivalent expression levels for all GFP-FUS R521G constructs.
Figure 6
Figure 6
Methylation of mutant-FUS is not required for its assembly into stress granules. HeLa cells transfected with GFP-FUS R495X were pre-treated with the methyltransferase inhibitor adenosine-2,3 dialdehyde (AdOx) and then exposed to sodium arsenite to promote stress granule assembly. (A) GFP-FUS R495X was detected by western analysis only for immunoprecipitation (IP) reactions from transfected cells (GFP-FUS (+)). Anti-GFP was used for both IP and western analyses. The ASYM24 antibody revealed that GFP-FUS R495X was hypomethylated on arginine residues when cells were pre-treated with AdOx. (B) Confocal fluorescence images revealed a robust association of GFP-FUS R459X with sodium arsenite-induced (SA(+)) stress granules, both in the absence (left panels) and presence (right panels) of AdOx. Conversely, the ASYM24 signal within the same stress granule was dramatically attenuated when cells were pre-treated with AdOx. (C) Quantification of n=3 independent experiments from (B) further supports the conclusions above. Statistical significance was determined by a Student’s t-test (** P < 0.01). All error bars represent SEMs.

References

    1. Calvio C, Neubauer G, Mann M, Lamond AI. Identification of hnRNP P2 as TLS/FUS using electrospray mass spectrometry. RNA. 1995;1:724–733. - PMC - PubMed
    1. Kwiatkowski TJ Jr, Bosco DA, Leclerc AL, Tamrazian E, Vanderburg CR, Russ C, Davis A, Gilchrist J, Kasarskis EJ, Munsat T. et al.Mutations in the FUS/TLS gene on chromosome 16 cause familial amyotrophic lateral sclerosis. Science. 2009;323:1205–1208. doi: 10.1126/science.1166066. - DOI - PubMed
    1. Vance C, Rogelj B, Hortobagyi T, De Vos KJ, Nishimura AL, Sreedharan J, Hu X, Smith B, Ruddy D, Wright P. et al.Mutations in FUS, an RNA processing protein, cause familial amyotrophic lateral sclerosis type 6. Science. 2009;323:1208–1211. doi: 10.1126/science.1165942. - DOI - PMC - PubMed
    1. Bosco DA, Landers JE. Genetic determinants of amyotrophic lateral sclerosis as therapeutic targets. CNS Neurol Disord Drug Targets. 2010;9:779–790. doi: 10.2174/187152710793237494. - DOI - PubMed
    1. Dormann D, Madl T, Valori CF, Bentmann E, Tahirovic S, Abou-Ajram C, Kremmer E, Ansorge O, Mackenzie IR, Neumann M, Haass C. Arginine methylation next to the PY-NLS modulates Transportin binding and nuclear import of FUS. EMBO J. 2012;31:4258–4275. doi: 10.1038/emboj.2012.261. - DOI - PMC - PubMed

Publication types

Substances