. 2013 Oct 4:10:120.
doi: 10.1186/1742-2094-10-120.

Inflammatory demyelination induces glia alterations and ganglion cell loss in the retina of an experimental autoimmune encephalomyelitis model

Affiliations

Inflammatory demyelination induces glia alterations and ganglion cell loss in the retina of an experimental autoimmune encephalomyelitis model

Lioba Horstmann et al. J Neuroinflammation. .

Abstract

Background: Multiple sclerosis (MS) is often accompanied by optic nerve inflammation. And some patients experience permanent vision loss. We examined if the grade of optic nerve infiltration and demyelination affects the severity of clinical signs in an experimental autoimmune encephalomyelitis (EAE) model. The loss of retinal ganglion cells (RGC) and alterations in glia activity were also investigated.

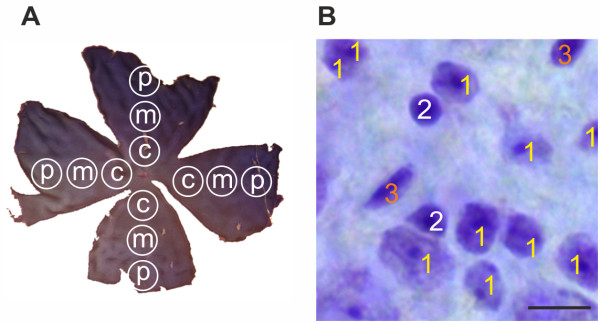
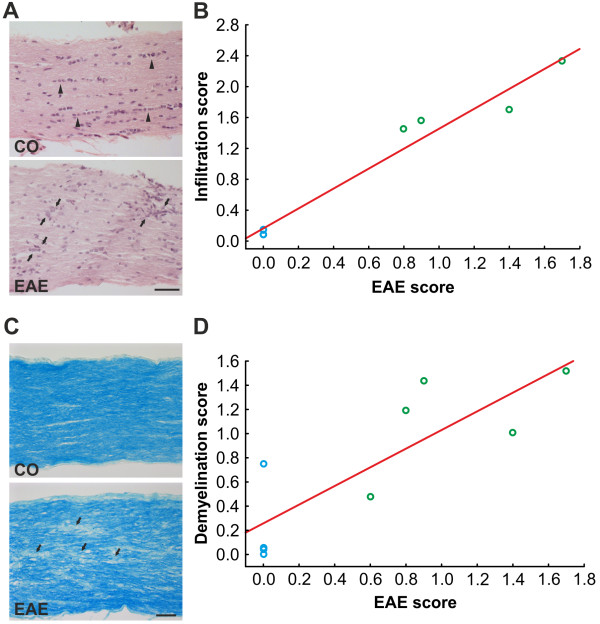
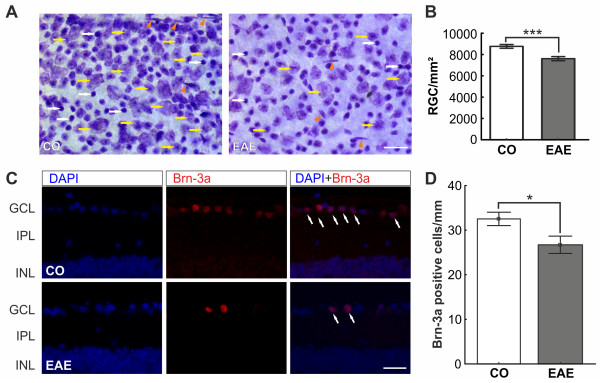
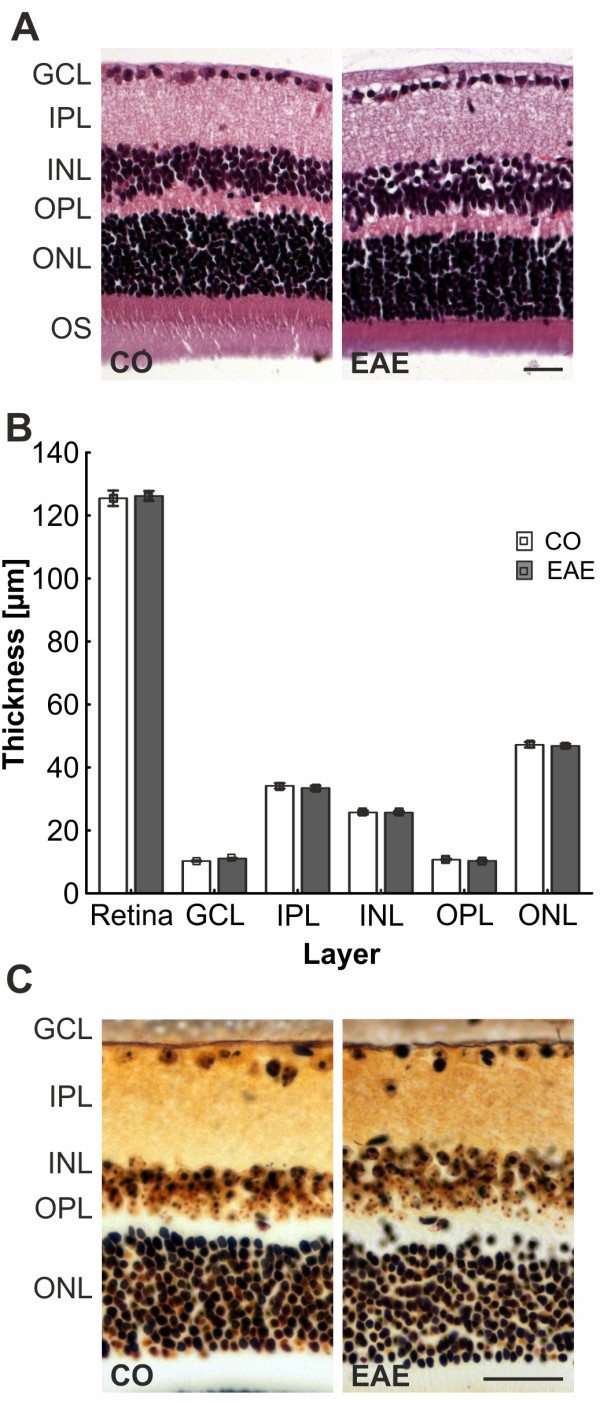
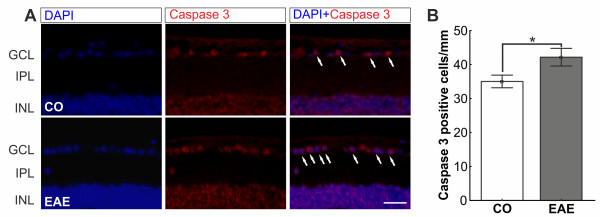
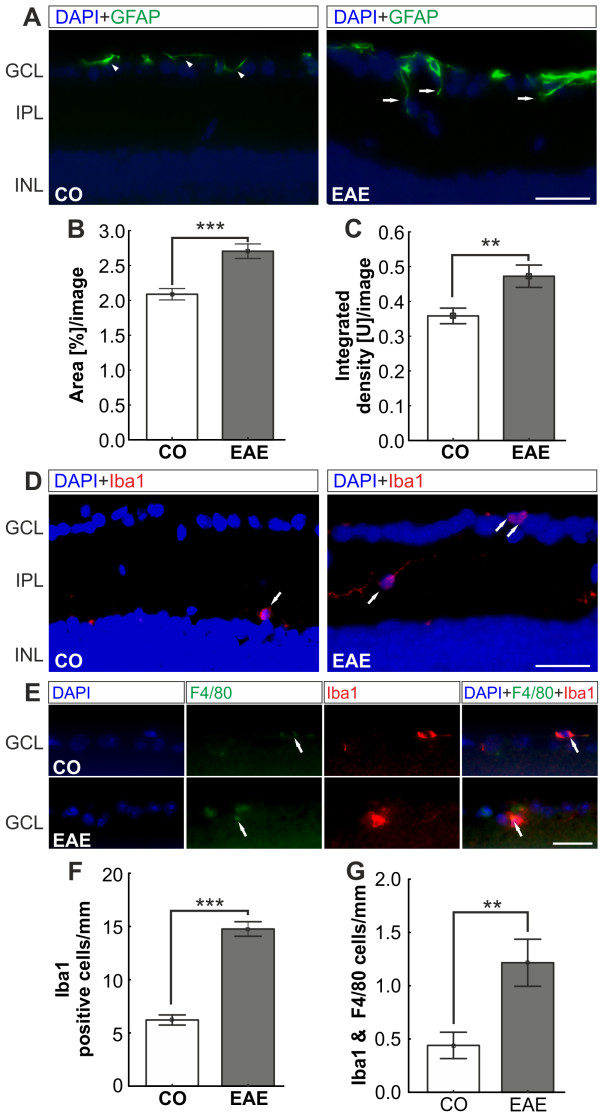
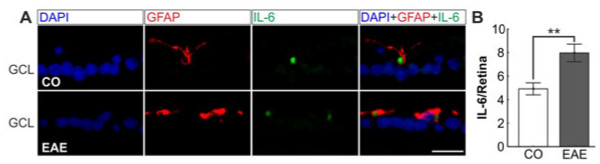
Methods: C57BL/6 mice were immunized with peptide MOG35-55 in complete Freund's adjuvant (CFA) and controls received PBS in CFA. Then 23 days post immunization eyes were prepared for flatmounts and stained with Nissl to evaluated neuronal density. Clinical EAE symptoms as well as cell infiltration and demyelination in the optic nerve were examined. Retinal sections were stained with hematoxylin and eosin and silver stain. Immunohistochemistry was used to label RGCs (Brn-3a), apoptotic cells (caspase 3), macroglia (glial fibrillary acidic protein (GFAP)), microglia (Iba1), macrophages (F 4/80) and interleukin-6 (IL-6) secretion.

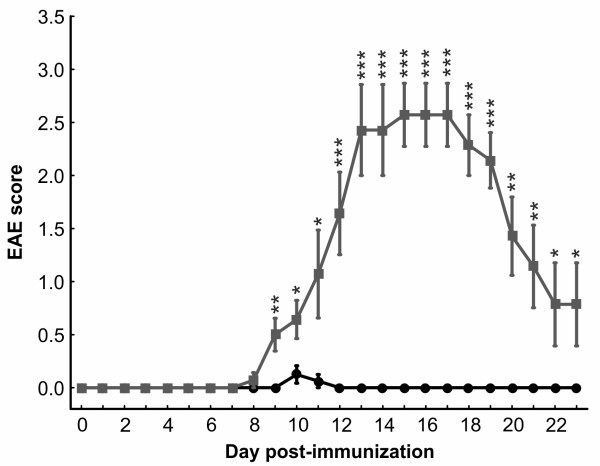
Results: EAE symptoms started at day 8 and peaked at day 15. Cell infiltrations (P = 0.0047) and demyelination (P = 0.0018) of EAE nerves correlated with the clinical score (r > 0.8). EAE led to a significant loss of RGCs (P< 0.0001). Significantly more caspase 3+ cells were noted in these animals (P = 0.0222). They showed an increased expression of GFAP (P< 0.0002) and a higher number of microglial cells (P< 0.0001). Also more macrophages and IL-6 secretion were observed in EAE mice.

Conclusions: MOG immunization leads to optic neuritis and RGC loss. EAE severity is related to the severity of optic nerve inflammation and demyelination. EAE not only affects activation of apoptotic signals, but also causes a glial response in the retina.


Figures

Figure 1
Figure 1
Areas and cell types of interest for data analysis. (A) Representative flatmount preparation showing three areas: central (c), middle (m) and peripheral (p). Photographs of each area in each arm were taken using an Axio Imager M1 microscope. (B) The pictures were analyzed using ImageJ software (1: neurons, 2: glia, 3: endothelia). Only neurons were included for further analysis. Scale bar: 10 μm.
Figure 2
Figure 2
Scores used for evaluation of EAE symptoms. Mice were examined daily using a clinical EAE scoring system ranging from 0 (no signs) to 5 (complete paralysis). The clinical symptoms were scored for 23 days. Symptoms peaked at day 15 (CO: 0 ± 0, EAE: 2.6 ± 0.3, P< 0.0001) and started to decline at day 17 post immunization. The abscissa represents the experimental days and the ordinate represents the severity of clinical symptoms (n = 8 to 9 animals/group). Black=CO, gray=EAE; *: p<0.05; **: p<0.01; ***: p<0.001. CO, control; EAE, experimental autoimmune encephalomyelitis.
Figure 3
Figure 3
Evaluation of changes in the optic nerve. (A) H&E-stained longitudinal optic nerve sections of EAE animals exhibited signs of optic neuritis indicated by cell clustering and disorganization (arrowheads) compared to a regular alignment of cells in the CO (arrows). (B) The infiltration score (from 0 for no infiltration to 4 for massive infiltration) positively correlated with the EAE score (P< 0.0001, r = 0.9824). CO mice (blue circles) had no clinical symptoms and infiltration while EAE mice (green circles) had both clinical symptoms and infiltration of cell clustering in the optic nerve (n = 4 eyes/group). (C) Luxol fast blue staining in longitudinal optic nerve sections of EAE animals revealed signs of demyelination indicated by white areas in the optic nerve (arrowheads). In CO nerves the myelin sheaths were uniformly stained. (D) The demyelination score (from 0 for no demyelination to 2 for strong demyelination) was positively correlated with the EAE score (P = 0.0053, r = 0.8328). CO animals displayed no signs of clinical EAE while in contrast all EAE mice had a clinical EAE score as well as mild to severe demyelination in the optic nerve (n = 5 eyes/group). Scale bars: 50 μm. CO, control; EAE, experimental autoimmune encephalomyelitis; H&E, hematoxylin and eosin stain.
Figure 4
Figure 4
RGC count in retina flatmounts and retina crosssections. (A) Representative Nissl-stained flatmounts of CO and EAE retinas reveal a loss of neurons (yellow arrows) in EAE retinas. The white arrows show glia cells and the arrowheads endothelial cells. Scale bar: 20 μm.(B) Quantification of neurons on retinal flatmounts (n = 8 eyes/group). The number of neurons (P< 0.0001) was significantly reduced in the EAE group after 23 days. (C) Immunohistochemical staining of CO and EAE retinas with Brn-3a (RGCs, red) and DAPI (nuclei, blue) 23 days post immunization. The merged picture shows a reduction of Brn-3a+ stained RGCs (arrows) in the GCL of EAE animals. (D) Quantification of Brn-3a+ cells in the retinas of CO and EAE animals (n = 5 to 7 eyes/group). RGC numbers were significantly reduced in the retinas of EAE mice (CO: 32.5 ± 1.5 cells/mm, EAE: 26.7 ± 1.9 cells/mm, P = 0.0170). Scale bar: 25 μm. *: p<0.05; ***: p<0.001. CO, control; EAE, experimental autoimmune encephalomyelitis; GCL, ganglion cell layer; INL, inner nuclear layer; IPL, inner plexiform layer; RGC, retinal ganglion cell.
Figure 5
Figure 5
Evaluation of infiltrates and neuronal plaques in the retina. (A) H&E-stained retina crosssections of CO (left) and EAE animals (right, n = 5 to 7 eyes/group). No difference between CO and EAE in retinal structure and no neuronal tangles and plaques were observed. (B) Quantification of the retinal layer thickness (n = 5 to 7 eyes/group). No difference was noted in the thickness of the layers. (C) Bielschowsky’s silver stain of retina sections of CO and EAE animals (n = 5 to 7 eyes/group). The retinal structure of EAE animals was not altered compared to CO and no neuronal plaques were noted. Scale bars: 25 μm. CO, control; EAE, experimental autoimmune encephalomyelitis; GCL, ganglion cell layer; INL, inner nuclear layer; IPL, inner plexiform layer; ONL, outer nuclear layer; OPL, outer plexiform layer; OS, outer segments.
Figure 6
Figure 6
Apoptosis in retina crosssections. (A) Immunohistochemical staining of CO and EAE retinas with caspase 3+ (apoptosis protein, red) and DAPI (nuclei, blue) 23 days post immunization. In the merged image more caspase 3+ cells (arrows) are visible in the GCL of EAE animals. (B) Mean cell count of caspase 3+ cells in the GCL of the retinas of CO and EAE animals at 23 days (n = 5 to 7 eyes/group). More caspase 3+ cells were noted in the retinas of EAE animals (CO: 35.0 ± 1.9 cells/mm, EAE: 42.2 ± 2.6 cells/mm, P = 0.0222). Scale bar: 25 μm. *: p<0.05. CO, control; EAE, experimental autoimmune encephalomyelitis; GCL, ganglion cell layer; INL, inner nuclear layer; IPL, inner plexiform layer.
Figure 7
Figure 7
Macroglial and microglial changes in EAE retinas. (A) Representative images of GFAP-stained CO and EAE retinas. The GFAP+ signal was only present in the Müller cell end-feet of CO animals (arrowheads) while it stretched into the IPL of EAE animals (arrows). (B) Quantification of the GFAP+ area (n = 5 to 7 eyes/group). EAE animals expressed significantly more GFAP+ protein compared to CO animals (P< 0.0001). (C)Quantification of fluorescence signal. EAE animals had significantly more GFAP+ signal than CO animals (P = 0.0033). (D) Iba1 staining of CO and EAE retinas. Iba1+ cells were predominantly located in the IPL of CO and EAE animals, but were more abundant in EAE animals. (E) Iba1 and F4/80 double staining of retina sections. Only a few microglial cells (Iba1, red) were also activated as macrophages in both groups (arrows). (F) Mean number of Iba1+ cells of retina crosssections (n = 5 to 7 eyes/group). More Iba1+ cells were located in the retinas of EAE animals (CO: 6.2 ± 0.5 cells/mm, EAE: 14.8 ± 0.7 cells/mm, P< 0.0001). (G) Statistical analysis showed significantly more Iba1 and F 4/80 co-labeled cells in EAE retinas (CO: 0.44 ± 0.12 cells/mm, EAE: 1.22 ± 0.22 cells/mm, P = 0.0023).Scale bars: 25 μm. **: p<0.01; ***: p<0.001. CO, control; EAE, experimental autoimmune encephalomyelitis; GCL, ganglion cell layer; GFAP, glial fibrillary acidic protein; INL, inner nuclear layer; IPL, inner plexiform layer.
Figure 8
Figure 8
Interleukin-6 secretion in the retina. (A) Sections of CO and EAE mice were double stained with IL-6 (green) and GFAP (red). The merged image shows IL-6 positive vesicles encapsulated by macroglial (GFAP) processes in CO and EAE animals. Scale bar: 20 μm. (B) Significantly more IL-6 positive vesicles were noted in EAE retinas (8.0 ± 0.8 vesicles/retina) compared to CO (4.9 ± 0.5 vesicles/retina, P = 0.0072). **: p<0.01; CO, control; EAE, experimental autoimmune encephalomyelitis; GCL, ganglion cell layer; GFAP, glial fibrillary acidic protein; IL-6, interleukin-6.

References

    1. Shindler KS, Revere K, Dutt M, Ying GS, Chung DC. In vivo detection of experimental optic neuritis by pupillometry. Exp Eye Res. 2012;100:1–6. - PMC - PubMed
    1. Shindler KS, Guan Y, Ventura E, Bennett J, Rostami A. Retinal ganglion cell loss induced by acute optic neuritis in a relapsing model of multiple sclerosis. MultScler. 2006;12:526–532. - PubMed
    1. Shindler KS, Ventura E, Dutt M, Rostami A. Inflammatory demyelination induces axonal injury and retinal ganglion cell apoptosis in experimental optic neuritis. Exp Eye Res. 2008;87:208–213. doi: 10.1016/j.exer.2008.05.017. - DOI - PMC - PubMed
    1. Korn T. Pathophysiology of multiple sclerosis. J Neurol. 2008;255(Suppl 6):2–6. - PubMed
    1. Steel DH, Waldock A. Measurement of the retinal nerve fibre layer with scanning laser polarimetry in patients with previous demyelinating optic neuritis. J NeurolNeurosurg Psychiatry. 1998;64:505–509. doi: 10.1136/jnnp.64.4.505. - DOI - PMC - PubMed

Publication types

MeSH terms