. 2013 Oct;123(10):4489-501.
doi: 10.1172/JCI69574. Epub 2013 Sep 16.

p16(INK4a) protects against dysfunctional telomere-induced ATR-dependent DNA damage responses

p16(INK4a) protects against dysfunctional telomere-induced ATR-dependent DNA damage responses

Yang Wang et al. J Clin Invest. 2013 Oct.

Abstract

Dysfunctional telomeres limit cellular proliferative capacity by activating the p53-p21- and p16(INK4a)-Rb-dependent DNA damage responses (DDRs). The p16(INK4a) tumor suppressor accumulates in aging tissues, is a biomarker for cellular senescence, and limits stem cell function in vivo. While the activation of a p53-dependent DDR by dysfunctional telomeres has been well documented in human cells and mouse models, the role for p16(INK4a) in response to telomere dysfunction remains unclear. Here, we generated protection of telomeres 1b p16-/- mice (Pot1bΔ/Δ;p16-/-) to address the function of p16(INK4a) in the setting of telomere dysfunction in vivo. We found that deletion of p16(INK4a) accelerated organ impairment and observed functional defects in highly proliferative organs, including the hematopoietic system, small intestine, and testes. Pot1bΔ/Δ;p16-/- hematopoietic cells exhibited increased telomere loss, increased chromosomal fusions, and telomere replication defects. p16(INK4a) deletion enhanced the activation of the ATR-dependent DDR in Pot1bΔ/Δ hematopoietic cells, leading to p53 stabilization, increased p21-dependent cell cycle arrest, and elevated p53-dependent apoptosis. In contrast to p16(INK4a), deletion of p21 did not activate ATR, rescued proliferative defects in Pot1bΔ/Δ hematopoietic cells, and significantly increased organismal lifespan. Our results provide experimental evidence that p16(INK4a) exerts protective functions in proliferative cells bearing dysfunctional telomeres.


Figures
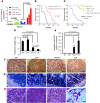
Figure 1
Figure 1. Loss of p16INK4a accelerates premature aging phenotypes in Pot1bΔ/Δ;mTR+/– and Pot1bΔ/Δ mice.
(A) Real-time PCR quantification of p16INK4a mRNA expression levels in young (10-week-old) and old (60-week-old) WT and Pot1b-null mouse spleens. Three individual samples were analyzed per genotype, and each experiment was repeated in triplicate. Error bars represent the SEM. A two-tailed Student’s t test was used to calculate statistical significance. (B) Kaplan-Meier survival analysis of Pot1bΔ/Δ;mTR+/– and Pot1bΔ/Δ;mTR+/;p16–/– mice. A log-rank test was used to calculate statistical significance. (C) Kaplan-Meier survival analysis showing the survival percentage of mice of the indicated genotypes as a function of age. All groups of mice were monitored for a minimum of 65 weeks and sacrificed when moribund. A log-rank test was used to calculate statistical significance. (D) Testicular weights from mice of the indicated genotypes. Each genotype includes testes from a minimum of 4 mice. Error bars represent the SEM. A two-tailed Student’s t test was used to calculate statistical significance. (E) Quantification of the number of apoptotic cells in basal crypts of small intestines isolated from WT, p16–/–, Pot1bΔ/Δ, and DK mice. Error bars represent the SEM. A two-tailed Student’s t test was used to calculate statistical significance. Representative H&E-stained histological sections of testes (F), small intestine (G), and BM (H) isolated from 40- to 45-week-old mice of the indicated genotypes. Original magnification, ×4 for testes and ×40 for intestines and BM. Arrowheads point to apoptotic intestinal cells.
Figure 2
Figure 2. Increased proliferative defects in DK hematopoietic cells.
(A) Quantification of total nucleated BM cells isolated from mice of the indicated genotypes (left panel), representative images from BM mononuclear cell colony-forming assays (CFAs) in M3434 media (middle panel) and quantification of CFAs from mice of the indicated genotypes at 8 to 10 weeks of age (right panel). Each genotype consists of cells isolated from a minimum of 4 mice. Error bars represent the SEM. (B) Same as A, except cells were isolated from mice of the indicated genotypes at 20 to 25 weeks of age. Error bars represent the SEM. (C) Representative Y chromosome–specific probe FISH images of BM transplantation experiments. Arrow points to labeled Y chromosome (gray); DAPI-stained cell nuclei. For A and B, a two-tailed Student’s t test was used to calculate statistical significance.
Figure 3
Figure 3. Increased loss of BM cells in aging Pot1bΔ/Δ;p16–/– mice.
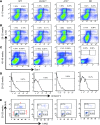
Representative FACS analysis of multilineage-negative cell populations derived from the BM of mice of the indicated genotypes at 8 to 10 weeks of age (A), 20 to 25 weeks of age (B), and 40 to 45 weeks of age (C). Numbers are the percentage of LSK and LK cells in total BM. Each genotype comprises a minimum of 4 mice. (D) Representative histograms showing annexin V profiles of LSK cells isolated from the BM of 20- to 25-week-old mice of the indicated genotypes. Each genotype includes cells from a minimum of 3 mice. (E) Cell cycle status of 20- to 25-week-old BrdU-labeled mouse LSK cells. A representative FACS plot from experiments with at least 3 mice of each indicated genotype is shown.
Figure 4
Figure 4. Severe telomere dysfunction in Pot1bΔ/Δ;p16–/– hematopoietic cells.
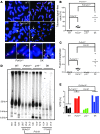
(A) Telomere FISH analysis on metaphase chromosome spreads of BM cells of the indicated genotypes using Tam-OO-(CCCTAA)4 telomere PNA (red) and DAPI (blue). A minimum of 50 metaphases were analyzed per genotype. Arrows indicate fused chromosomes; red arrowheads indicate signal-free ends. Bottom panels show examples of the fragile telomere phenotype observed in 40- to 45-week-old Pot1bΔ/Δ and DK mouse BM cells. White arrowheads point to fragile telomeres. (B) Quantification of the number of telomere signal–free ends found in BM metaphases isolated from mice of the indicated genotypes. n = 4 for each genotype examined. A two-tailed Student’s t test was used to calculate statistical significance. (C) Quantification of the number of chromosome fusions in BM metaphases isolated from mice of the indicated genotypes. n = 4 for each genotype examined. A two-tailed Student’s t test was used to calculate statistical significance. (D) Telomere length determination in 40- to 45-week-old mouse spleen cells. HinfI/RsaI digested splenocyte genomic DNA of the indicated genotypes was hybridized under denatured conditions with a 32P-labeled [CCCTAA]4-oligo to detect total telomere DNA. Telomere signal intensity (percentage) was quantified by setting WT total telomere DNA as 100%. A two-tailed Student’s t test was used to calculate statistical significance. (E) Quantification of fragile telomeres observed in BM cells of the indicated genotypes. A total of 50 metaphases were scored for each mouse, and quantification of MTSs from metaphases isolated from individual animals is shown. A two-tailed Student’s t test was used to calculate statistical significance.
Figure 5
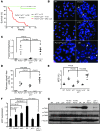
Figure 5. Elevated ATR-dependent DDR and p53 stabilization in Pot1bΔ/Δ;p16–/– mice.
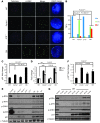
(A) Representative TIF images of LSK cells from mice of the indicated genotypes. Cells were stained with anti–γ-H2Ax antibody (green), the PNA telomere probe Tam-OO-(CCCTAA)4 (red), and DAPI (blue). A minimum of three 20- to 25-week-old mice per genotype were used in all analyses. (B) Quantification of the percentage of cells with γ-H2AX–positive TIF in LSK cells of the indicated genotypes. A total of 150 nuclei were scored per genotype. A two-tailed Student’s t test was used to calculate statistical significance. Error bars represent the SEM. (C and D) Representative real-time PCR quantification of mRNA expression levels of p21 (C) and Puma and Bax (D) in sorted LSK cells from 20- to 25-week-old mice of the indicated genotypes. Each experiment was repeated in triplicate. P < 0.01 for both ** and ***. Error bars represent the SEM. (E) Immunoblot analysis for p-RPA, p-ATR, p-CHK1, p-p53, and p21 levels in 40- to 45-week-old spleens from mice of the indicated genotypes. Aphidicolin-treated cells were used as positive controls, and γ-tubulin served as a loading control. (F) Real-time PCR quantification of p19Arf expression levels of sorted LSK cells from mice of the indicated genotypes. Each experiment was repeated in triplicate. Error bars represent the SEM, and a two-tailed Student’s t test was used to calculate statistical significance. (G) Immunoblot analysis for p-RPA, p-ATR, p-CHK1, and p21 levels in DK mouse spleens of the indicated ages. γ-Tubulin served as a loading control.
Figure 6
Figure 6. Deletion of p21 rescues the proliferative defects of Pot1bΔ/Δ hematopoietic cells.
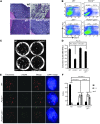
(A) BM morphology in femurs isolated from 70- to 80-week-old mice of the indicated genotypes. Original magnification, ×10. (B) Representative FACS analysis of a multilineage-negative population in total BM isolated from 70- to 80-week-old mice of the indicated genotypes. Numbers are the percentage of LSK and LK cells in total BM. Each group represents a minimum of 4 mice. (C) Representative images of CFUs from BM MNCs of the indicated genotypes. (D) Quantification of CFUs. n = 4 mice per genotype. Error bars represent the SEM, and a two-tailed Student’s t test was used to calculate statistical significance. (E) Representative TIF images of LSK cells of the indicated genotypes. Cells were stained with anti–γ-H2Ax antibody (green), PNA probe Tam-OO-(CCCTAA)4 (red), and DAPI (blue). Cells derived from a minimum of three 40- to 45-week-old mice per genotype were used in each experiment. (F) Quantification of the percentage of cells with γ-H2AX–positive TIF in LSK cells of the indicated genotypes. A total of 150 nuclei were scored per genotype. Error bars represent the SEM, and a two-tailed Student’s t test was used to calculate statistical significance.
Figure 7
Figure 7. Pot1bΔ/Δ;p21–/– mice exhibit increased lifespan and a stable genome with minimal ATR activation.
(A) Kaplan-Meier survival analysis of Pot1bΔ/Δ;p21–/– and DK mice. A log-rank test was used to calculate statistical significance. (B) Telomere PNA-FISH revealed end-to-end chromosome fusions (white arrows) and telomere signal–free ends (red arrowheads) from BM metaphase spreads of the indicated genotypes. (C) Quantification of the number of chromosome fusions per metaphase in A. (D) Quantification of telomere signal–free chromosome ends in A. For both C and D, a total of 50 metaphases were scored per mouse, and a minimum of 4 mice were used per genotype. A two-tailed Student’s t test was used to calculate statistical significance. (E) Quantification of MTSs observed in BM metaphases from mice of the indicated genotypes. A total of 50 metaphases were scored per mouse, and a minimum of 4 mice were used per genotype. A two-tailed Student’s t test was used to calculate statistical significance. (F) Real-time PCR of E2f1 mRNA expression levels in spleens of the indicated genotypes. Each experiment was repeated in triplicate. A two-tailed Student’s t test was used to calculate statistical significance. (G) Western blot analysis of phosphorylated CHK1 and CHK2 levels in spleens from mice of the indicated genotypes. γ-Tubulin served as a loading control. The ages of the mice from which the spleens were harvested are indicated.

Similar articles

Cited by

References

    1. O’Sullivan RJ, Karlseder J. Telomeres: protecting chromosomes against genome instability. Nat Rev Mol Cell Biol. 2012;11(3):171–181. - PMC - PubMed
    1. Palm W, de Lange T. How shelterin protects mammalian telomeres. Annu Rev Genet. 2008;42:301–334. doi: 10.1146/annurev.genet.41.110306.130350. - DOI - PubMed
    1. Chan SS, Chang S. Defending the end zone: studying the players involved in protecting chromosome ends. FEBS Lett. 2010;584(17):3773–3778. doi: 10.1016/j.febslet.2010.06.016. - DOI - PMC - PubMed
    1. Boultwood J, et al. Telomere length in myelodysplastic syndromes. Am J Hematol. 1997;56(4):266–271. doi: 10.1002/(SICI)1096-8652(199712)56:4<266::AID-AJH12>3.0.CO;2-7. - DOI - PubMed
    1. Calado RT, Young NS. Telomere maintenance and human bone marrow failure. Blood. 2008;111(9):4446–4455. doi: 10.1182/blood-2007-08-019729. - DOI - PMC - PubMed

Publication types

MeSH terms

Substances