Regional cerebral blood flow in children from 3 to 5 months of age
- PMID: 24091444
- PMCID: PMC7964707
- DOI: 10.3174/ajnr.A3728
Regional cerebral blood flow in children from 3 to 5 months of age
Abstract
Background and purpose: Understanding the relationship between brain and behavior in early childhood requires a probe of functional brain development. We report the first large study of regional CBF by use of arterial spin-labeling in young children.
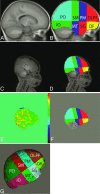
Materials and methods: Cerebral blood flow by use of arterial spin-labeling was measured in 61 healthy children between the ages of 3 and 5 months. Blood flow maps were parcellated into 8 broadly defined anatomic regions of each cerebral hemisphere.
Results: There was no sex effect; however, group analysis demonstrated significantly greater CBF in the sensorimotor and occipital regions compared with dorsolateral prefrontal, subgenual, and orbitofrontal areas (P < .0001). A significant age effect was also identified, with the largest increase in blood flow between 3 and 5 months occurring in the following regions: orbitofrontal (P < .009), subgenual (P < .002), and inferior occipital lobe (P = .001).
Conclusions: These results are consistent with prior histologic studies demonstrating regional variation in brain maturation and suggest that arterial spin-labeling is sensitive to regional as well as age-related differences in CBF in young children.
Conflict of interest statement
The authors have no potential conflicts of interest with respect to the research, authorship, and/or publication of this article.
Figures


References
-
- Carey WB, Crocker AC, Coleman WL, et al. Developmental-Behavioral Pediatrics. 4th ed. Philadelphia: Elsevier; 2009:40–49
-
- Huttenlocher PR, Dabholkar AS. Regional differences in synaptogenesis in human cerebral cortex. J Comp Neurol 1997;387:167–68 - PubMed
-
- Shankle WR, Rafii MS, Landing BH, et al. Approximate doubling of numbers of neurons in postnatal human cerebral cortex and in 35 specific cytoarchitectural areas from birth to 72 months. Pediatr Dev Pathol 1999;2:244–59 - PubMed
-
- Barkovich AJ. Brain development: normal and abnormal. In: Atlas SW, ed. Magnetic Resonance Imaging of the Brain and Spine. New York: Raven Press; 1991:129–75
-
- Chugani HT. A critical period of brain development: studies of cerebral glucose utilization with PET. Prev Med 1998;27:184–88 - PubMed
Publication types
MeSH terms
Substances
Grants and funding
LinkOut - more resources
Full Text Sources
Other Literature Sources
