. 2013 Dec 1;12(23):3640-9.
doi: 10.4161/cc.26580. Epub 2013 Oct 1.

Single cell heterogeneity: why unstable genomes are incompatible with average profiles

Affiliations

Single cell heterogeneity: why unstable genomes are incompatible with average profiles

Batoul Y Abdallah et al. Cell Cycle. .

Abstract

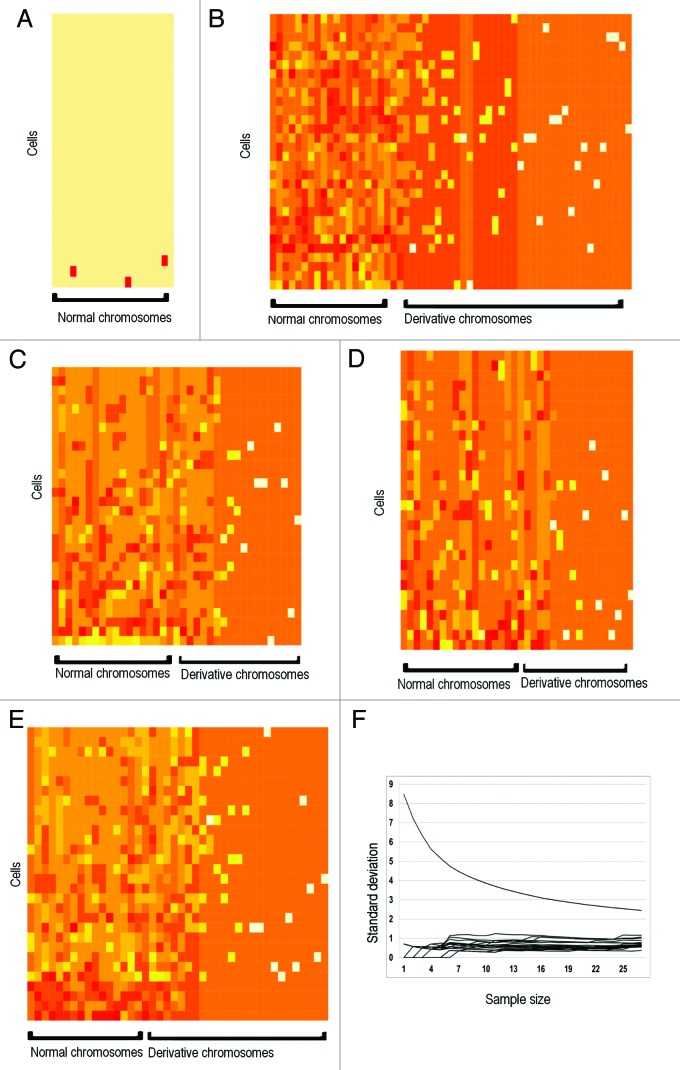
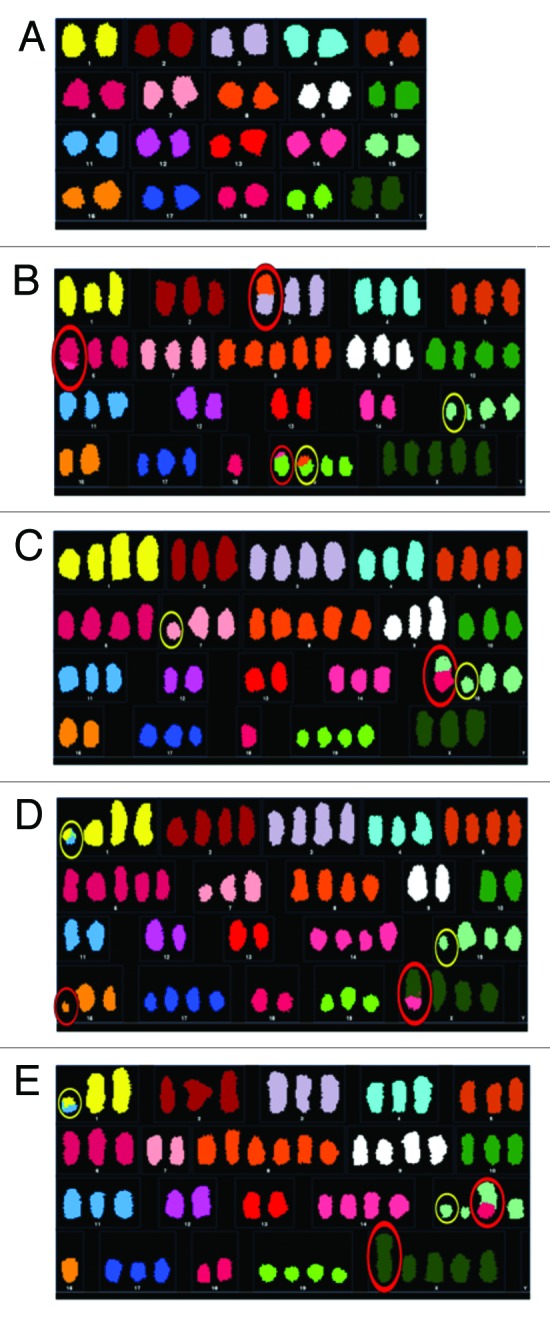
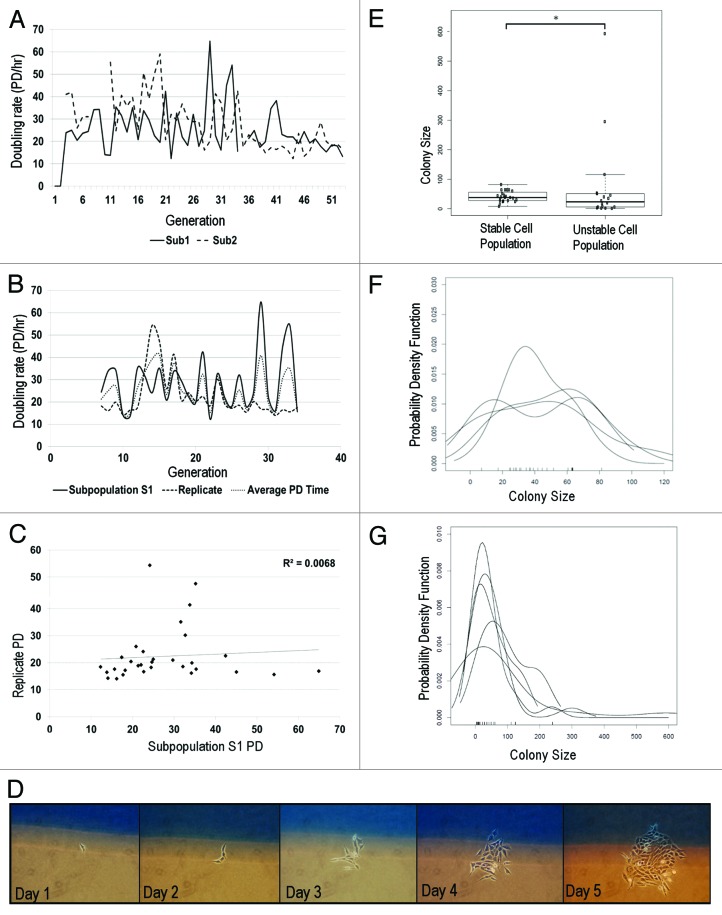
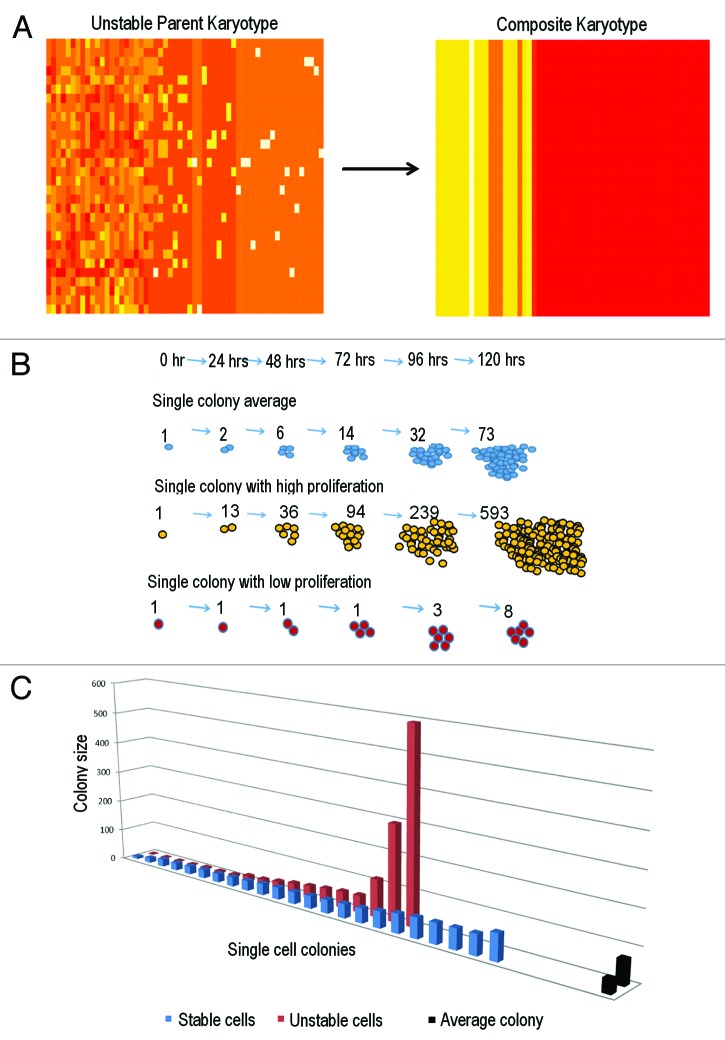
Multi-level heterogeneity is a fundamental but underappreciated feature of cancer. Most technical and analytical methods either completely ignore heterogeneity or do not fully account for it, as heterogeneity has been considered noise that needs to be eliminated. We have used single-cell and population-based assays to describe an instability-mediated mechanism where genome heterogeneity drastically affects cell growth and cannot be accurately measured using conventional averages. First, we show that most unstable cancer cell populations exhibit high levels of karyotype heterogeneity, where it is difficult, if not impossible, to karyotypically clone cells. Second, by comparing stable and unstable cell populations, we show that instability-mediated karyotype heterogeneity leads to growth heterogeneity, where outliers dominantly contribute to population growth and exhibit shorter cell cycles. Predictability of population growth is more difficult for heterogeneous cell populations than for homogenous cell populations. Since "outliers" play an important role in cancer evolution, where genome instability is the key feature, averaging methods used to characterize cell populations are misleading. Variances quantify heterogeneity; means (averages) smooth heterogeneity, invariably hiding it. Cell populations of pathological conditions with high genome instability, like cancer, behave differently than karyotypically homogeneous cell populations. Single-cell analysis is thus needed when cells are not genomically identical. Despite increased attention given to single-cell variation mediated heterogeneity of cancer cells, continued use of average-based methods is not only inaccurate but deceptive, as the "average" cancer cell clearly does not exist. Genome-level heterogeneity also may explain population heterogeneity, drug resistance, and cancer evolution.

Keywords: genome theory; genomic instability; nonclonal chromosomal aberration; punctuated cancer evolution; tumor heterogeneity.


Figures

None
Figure 1. Genomic heterogeneity of heterogeneous cell populations. (A) Heatmap karyotype of early passage (day 2) wild-type mouse ovarian surface epithelial cells. Most cells have a normal karyotype. (B) Heatmap karyotype of spontaneously transformed parent cell population after 1 y in culture. Cell populations exhibit high aneuploidy and high NCCA frequency. (C and D) Heatmap karyotype of spontaneously transformed single cell-derived subpopulation S1 (C) 23 d after single cell isolation and subpopulation S2 (D) 40 d after single cell isolation. Both subpopulations exhibit a high degree of karyotypic heterogeneity. No direct intermediates were identified between both subpopulations and parent population. (E) Heatmap karyotype of subpopulation S1 117 d after single-cell isolation demonstrates increase in NCCA frequency. (F) Determination of sample size. Each series on the graph represents variation of a single chromosome, where sample size is plotted on the x-axis and standard deviation on the y-axis. Variation among all chromosomes decrease with increasing sample size, and begin to level off at approximately 15 cells. At least 30 cells/sample were analyzed.
None
Figure 2. Representative karyotypes of cells from each cell population. Representative karyotypes of early passage MOSE cells (A), parent population after one year in culture (B), single cell derived subpopulation 1, 23 d post-single-cell isolation (C), single-cell-derived subpopulation 2, 40 d post-single-cell isolation (D), and single-cell-derived subpopulation 1, 117 d post-single-cell isolation (E). Structural NCCAs are circled in red; structural CCAs are circled in yellow.
None
Figure 3: Genome-mediated growth heterogeneity. (A) Population doubling rates of 2 subpopulations isolated from same parent. Each subpopulation exhibits unique growth rate. Variation in PD rates is moderate, as measured by CV (subpopulation 1, 40%; subpopulation 2, 42%) (B) PD rate comparison of 2 independent runs of same subpopulation. Each trial exhibits moderate variation in growth, despite being biological replicates. (Set 1 CV = 44%; Set 2 CV = 45%, n = 2) (C) Regression analysis comparing doubling times of 2 replicates of same subpopulation show no correlation (r2 = 0.0068) (D) In situ single cell growth. Single cells are identified on day 1 and monitored daily. (E) Growth is compared between HCT116 (n = 23) and unstable cells (n = 18). Unstable cells (CV = 200%) display significantly greater growth variation than karyotypically homogeneous HCT 116 cells (CV = 44%). (F-test, P ≤ 1.4 × 10⁻⁶) (F and G): Density growth distributions of stable (F) and unstable (G) cell population replicates. Growth distribution of stable cells are unimodal with a narrow distribution, while unstable cells are bimodal and exhibit extremely broad growth distributions.
None
Figure 4. Arithmetic mean is a poor measure for genomically heterogeneous populations. (A) Composite heatmap karyotype of parent population is completed by averaging chromosome and NCCA frequencies. The composite cell does not contain any NCCAs that are present in individual cells and does not reflect range of aneuploidy observed in all cells. (B) Schematic of single-colony growth. Daily proliferation was counted, averaged, and compared with high and low proliferating colonies. (C) Comparison of single cell colony proliferation to population average in Brca1/p53 unstable cell subpopulation and stable HCT116 cells. Average colony size is calculated at 73 cells in Sub1 and 41 cells in HCT116 (indicated by black columns on far right). Most colonies among the unstable cell population are well under the average, indicating that outliers dominate population behavior and the average is not a representative measure for genomically unstable cell population

References

    1. Heng HH, Liu G, Stevens JB, Bremer SW, Ye KJ, Abdallah BY, Horne SD, Ye CJ. Decoding the genome beyond sequencing: the new phase of genomic research. Genomics. 2011;98:242–52. doi: 10.1016/j.ygeno.2011.05.008. - DOI - PubMed
    1. Heng HH, Stevens JB, Bremer SW, Liu G, Abdallah BY, Ye CJ. Evolutionary mechanisms and diversity in cancer. Adv Cancer Res. 2011;112:217–53. doi: 10.1016/B978-0-12-387688-1.00008-9. - DOI - PubMed
    1. Huang S, Ernberg I, Kauffman S. Cancer attractors: a systems view of tumors from a gene network dynamics and developmental perspective. Semin Cell Dev Biol. 2009;20:869–76. doi: 10.1016/j.semcdb.2009.07.003. - DOI - PMC - PubMed
    1. Pelkmans L. Cell Biology. Using cell-to-cell variability--a new era in molecular biology. Science. 2012;336:425–6. doi: 10.1126/science.1222161. - DOI - PubMed
    1. Stevens JB, Abdallah BY, Liu G, Ye CJ, Horne SD, Wang G, Savasan S, Shekhar M, Krawetz SA, Hüttemann M, et al. Diverse system stresses: common mechanisms of chromosome fragmentation. Cell Death Dis. 2011;2:e178. doi: 10.1038/cddis.2011.60. - DOI - PMC - PubMed

Publication types

LinkOut - more resources