. 2013 Oct 3:3:2802.
doi: 10.1038/srep02802.

First biological measurements of deep-sea corals from the Red Sea

Affiliations

First biological measurements of deep-sea corals from the Red Sea

C Roder et al. Sci Rep. .

Abstract

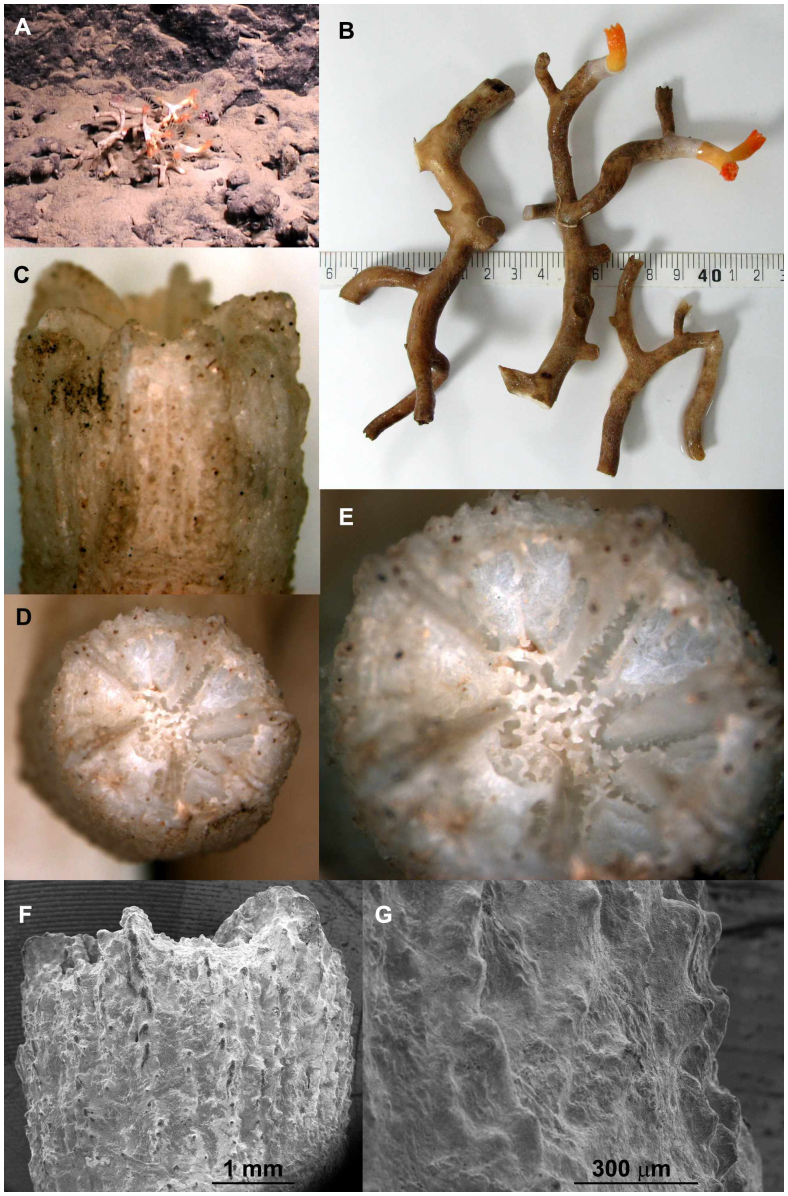
It is usually assumed that metabolic constraints restrict deep-sea corals to cold-water habitats, with 'deep-sea' and 'cold-water' corals often used as synonymous. Here we report on the first measurements of biological characters of deep-sea corals from the central Red Sea, where they occur at temperatures exceeding 20°C in highly oligotrophic and oxygen-limited waters. Low respiration rates, low calcification rates, and minimized tissue cover indicate that a reduced metabolism is one of the key adaptations to prevailing environmental conditions. We investigated four sites and encountered six species of which at least two appear to be undescribed. One species is previously reported from the Red Sea but occurs in deep cold waters outside the Red Sea raising interesting questions about presumed environmental constraints for other deep-sea corals. Our findings suggest that the present understanding of deep-sea coral persistence and resilience needs to be revisited.


Figures

Figure 1
Figure 1
(A) Depth profiles (y-axes) of physical and biogeochemical water properties of the Red Sea. Left graph: temperature, salinity, oxygen concentration. Middle graph: pH, total alkalinity (TA), aragonite saturation (Ωarag). Right graph: nitrate plus nitrite concentrations, carbon-to-nitrogen ratios, total suspended matter (TSM) contents. Solid black lines in each graph indicate the margin of the photic zone (1% surface radiation) for all wavelengths within the spectral photosynthetically active radiation (PAR) range. Differently dashed lines represent distribution depths of the three sampled coral species: the style of the dashed line indicates the respective coral species in its preferred habitat ((B) Eguchipsammia fistula; (C) Species A; (D) Dendrophyllia sp.). Images obtained with ROV camera.
Figure 2
Figure 2. Eguchipsammia fistula, Dendrophylliidae.
(a) Habitat view. (b) Lateral view of corallum. (c) Colony view (scalebar in cm). (d) and (e) Calicular view of corallum. (f) and (g) Close-up (SEM) of the theca half way up the corallum. Image a obtained with ROV camera. Image c by Roder/Voolstra. Images b, d, e, f, g by Bouwmeester.
Figure 3
Figure 3. Dendrophyllia sp, Dendrophylliidae.
(a) Habitat view. (b) Colony view (scalebar in cm). (c) Lateral view of corallum. (d) and (e) Calicular view of corallum. (f) Close-up (SEM) of the theca at the top of the corallum. (g) Close-up (SEM) of the microstructure of the theca. Image a obtained with ROV camera. Image b by Roder/Voolstra. Images c, d, e, f, g by Bouwmeester.
Figure 4
Figure 4. Species A (undetermined), Caryophylliidae.
(a) Habitat view. (b) Colony view (scalebar in cm). (c) Lateral view of corallum. (d) and (e) Calicular view of corallum. (f) and (g) Close-up (SEM) of the theca half way up the corallum and at the top of the corallum respectively. Image a obtained with ROV camera. Image b by Roder/Voolstra. Images c, d, e, f, g by Bouwmeester.
Figure 5
Figure 5. Molecular phylogram of relations among 24 species of corals and Hydra vulgaris (outgroup) as determined by Bayesian, Maximum Likelihood, and Neighbor-Joining analyses.
This phylogram was generated on the basis of sequences from the mitochondrial 16S ribosomal gene region. The numbers on the branches represent values from 1,000 bootstrap replicates presented in the order of Bayesian/Maximum Likelihood/Neighbor-Joining. Azooxanthellate species are denoted by $, Red Sea species by ***. NJ: Neighbor-Joining. Images by Roder/Voolstra.
Figure 6
Figure 6
(A) Calcification (G) and respiration (R) rates (± SE) of three coral species found in the deep Red Sea (Eguchipsammia fistula, species A (Caryophyllidae), Dendrophyllia sp.). (B) Stable isotope measurements of δ13C and δ15N in the particulate organic matter (POM) fraction of the total suspended material in reef water from the Red Sea and of the tissue of the three coral species found in the Red Sea.

References

    1. Cairns S. Species richness of recent scleractinia. Atoll Res. Bull. 459, 1–12 (1999).
    1. Roberts J. M., Wheeler A. J. & Freiwald A. Reefs of the deep: the biology and geology of cold-water coral ecosystems. Science 312, 543–547 (2006). - PubMed
    1. Davies A. J. & Guinotte J. M. Global habitat suitability for framework-forming cold-water corals. PLoS One 6, e18483 (2011). - PMC - PubMed
    1. Davies A. et al. Downwelling and deep-water bottom currents as food supply mechanisms to the cold-water coral Lophelia pertusa (Scleractinia) at the Mingulay Reef complex. Limnol. Oceanogr. 54, 620–629 (2009).
    1. Rogers A. D. The biology of seamounts. Adv. Mar. Biol. 30, 305–350 (1994). - PubMed

Substances

Associated data

LinkOut - more resources